Girish Mahajan (Editor)

Timeline of the 1995 Atlantic hurricane season

Updated on
Edit
Like
Comment
Share on FacebookTweet on TwitterShare on LinkedInShare on Reddit
Timeline of the 1995 Atlantic hurricane season

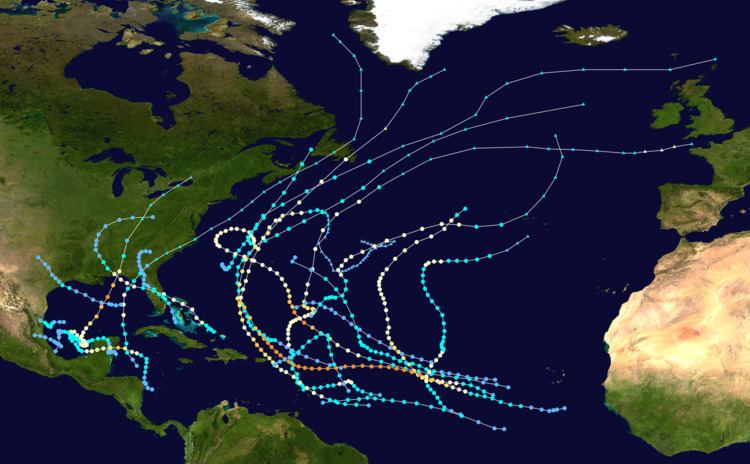
The 1995 Atlantic hurricane season was a very active year in which nineteen named storms formed, tying it with the seasons of 1887, 2010, 2011, and 2012 for the third most active hurricane season on record. The season officially began on June 1, with the first tropical cyclone, Hurricane Allison, forming just the next day. The season ended on November 30. These dates conventionally delimit the period of each year when most tropical cyclones develop in the Atlantic basin. The season's last storm, Hurricane Tanya, dissipated on November 3.

Contents

The season produced twenty-one tropical cyclones, of which nineteen intensified into tropical storms, eleven became hurricanes, and five became major hurricanes. The three most notable storms during the season were hurricanes Luis, Marilyn, and Opal. Hurricane Luis was a powerful Cape Verde-type hurricane that caused extensive damage in the northern Leeward Islands. Hurricane Marilyn affected the same area a few days later, becoming the most destructive hurricane to hit the U.S. Virgin Islands since Hurricane Hugo in 1989. Opal was a strong hurricane that made landfall near Pensacola Beach, Florida. The system caused $5.1 billion (1995 USD) in damage.

This timeline includes information that was not operationally released, meaning that information from post-storm reviews by the National Hurricane Center, such as a storm that was not operationally warned upon, has been included. This timeline documents tropical cyclone formations, strengthening, weakening, landfalls, extratropical transitions, and dissipations during the season.

June

June 1

  • The 1995 Atlantic hurricane season officially begins.
  • June 2

  • 00:00 UTC (8:00 p.m. EDT June 2) – Tropical Depression One develops from an area of low pressure roughly 230 mi (370 km) east of Belize City, Belize.
  • 12:00 UTC (8:00 a.m. EDT) – Tropical Depression One strengthens into Tropical Storm Allison, the first named storm of the 1995 season.
  • June 4

  • 12:00 UTC (8:00 a.m. EDT) – Tropical Storm Allison intensifies into a Category 1 hurricane, while simultaneously peaking with maximum sustained winds of 75 mph (120 km/h) and a minimum barometric pressure of 987 mbar (29.1 inHg).
  • June 5

  • 06:00 UTC (2:00 a.m. EDT) – Hurricane Allison weakens to a tropical storm.
  • 14:00 UTC (10:00 a.m. EDT) – Tropical Storm Allison makes landfall near Alligator Point, Florida with winds of 70 mph (110 km/h).
  • 15:00 UTC (11:00 a.m. EDT) – Tropical Storm Allison makes another landfall near Saint Marks, Florida with winds of 65 mph (105 km/h).
  • June 6

  • 00:00 UTC (8:00 p.m. EDT June 5) – Tropical Storm Allison weakens to a tropical depression over southeastern Georgia.
  • 06:00 UTC (2:00 a.m. EDT) – Tropical Depression Allison transitions into an extratropical cyclone.
  • July

    July 6

  • 18:00 UTC (2:00 p.m. EDT) – Tropical Depression Two forms from an frontal low-pressure area while located about 425 mi (685 km) west of Bermuda.
  • July 7

  • 06:00 UTC (2:00 a.m. EDT) – Tropical Depression Two intensifies into Tropical Storm Barry while located west-southwest of Bermuda.
  • 21:00 UTC (5:00 p.m. EDT) – Tropical Storm Barry attains its maximum sustained wind speed of 70 mph (115 km/h).
  • July 9

  • 21:30 UTC (5:30 p.m. EDT) – Tropical Storm Barry makes landfall near Hart Island, Nova Scotia with winds of 60 mph (95 km/h).
  • 22:00 UTC (6:00 p.m. EDT) – Tropical Storm Barry makes another landfall near Cape Breton Island, Nova Scotia with winds of 50 mph (80 km/h).
  • July 10

  • 00:00 UTC (8:00 p.m. EDT July 9) – Tropical Storm Barry attains its minimum barometric pressure of 990 mbar (29 inHg).
  • 06:00 UTC (2:00 a.m. EDT) – Tropical Storm Barry transitions into an extratropical cyclone near the western coast of Newfoundland.
  • July 12

  • 00:00 UTC (8:00 p.m. EDT July 11) – Tropical Depression Three forms from an area of low pressure while located a few hundred mi east of the northern Leeward Islands.
  • July 14

  • 00:00 UTC (8:00 p.m. EDT July 13) – Tropical Depression Three intensifies into a Tropical Storm Chantal while located northeast of Puerto Rico.
  • July 17

  • 00:00 UTC (8:00 p.m. EDT July 16) – Tropical Storm Chantal reaches its peak intensity with maximum sustained winds of 70 mph (115 km/h) and a minimum barometric pressure of 991 mbar (29.3 inHg).
  • July 20

  • 18:00 UTC (2:00 p.m. EDT) – Tropical Storm Chantal transitions into an extratropical cyclone southeast of Newfoundland.
  • July 28

  • 18:00 UTC (1:00 p.m. CDT) – Tropical Depression Four forms from an area of low pressure roughly 300 mi (485 km) southeast of New Orleans, Louisiana.
  • July 30

  • 18:00 UTC (2:00 p.m. EDT) – Tropical Depression Four intensifies into Tropical Storm Dean while located roughly 60 mi (95 km) from the upper Texas coast.
  • July 31

  • 00:00 UTC (7:00 p.m. CDT July 30) – Tropical Storm Dean reaches its peak intensity with maximum sustained winds of 45 mph (70 km/h) and a minimum barometric pressure of 999 mbar (29.5 inHg).
  • 00:00 UTC (8:00 p.m. EDT July 30) – Tropical Storm Erin forms from an area of low pressure in the southeastern Bahamas.
  • 02:00 UTC (9:00 p.m. CDT July 30) – Tropical Storm Dean makes a first and final landfall near Freeport, Texas with winds of 45 mph (70 km/h).
  • 06:00 UTC (1:00 a.m. CDT) – Tropical Storm Dean weakens to a tropical depression over southeastern Texas.
  • August

    August 1

  • 00:00 UTC (8:00 p.m. EDT July 31) – Tropical Storm Erin intensifies into a Category 1 hurricane near Rum Cay in the Bahamas.
  • August 2

  • 06:15 UTC (2:15 a.m. EDT) – Hurricane Erin makes a first landfall near Vero Beach, Florida with winds of 85 mph (135 km/h).
  • 12:00 UTC (8:00 a.m. EDT) – Hurricane Erin weakens to a tropical storm over central Florida.
  • August 3

  • 00:00 UTC (7:00 p.m. CDT August 2) – Tropical Depression Dean dissipates into a non-convective remnant area of low pressure near the Texas–Oklahoma border.
  • 00:00 UTC (8:00 p.m. EDT August 2) – Tropical Storm Erin re-intensifies into a Category 1 hurricane over the eastern Gulf of Mexico.
  • 13:30 UTC (9:30 a.m. EDT) – Hurricane Erin attains its maximum sustained winds of 100 mph (160 km/h) and concurrently makes a second landfall near Fort Walton Beach, Florida at this intensity.
  • 16:00 UTC (12:00 p.m. EDT) – Hurricane Erin attains its minimum barometric pressure of 973 mbar (28.7 inHg) and concurrently makes a third and final landfall near Pensacola Beach, Florida with winds of 85 mph (135 km/h).
  • August 4

  • 00:00 UTC (7:00 p.m. CDT August 3) – Hurricane Erin weakens to a tropical storm over southeastern Mississippi.
  • 12:00 UTC (7:00 a.m. CDT) – Tropical Storm Erin weakens to a tropical depression.
  • August 5

  • 18:00 UTC (1:00 p.m. CDT) – Tropical Depression Six develops from an area of low pressure in the Bay of Campeche.
  • August 6

  • 12:00 UTC (7:00 a.m. CDT) – Tropical Depression Erin merges with a frontal system over West Virginia.
  • 23:00 UTC (6:00 p.m. CDT) – Tropical Depression Six makes landfall near Cabo Rojo, Mexico with winds of 35 mph (55 km/h).
  • August 7

  • 00:00 UTC (7:00 p.m. CDT August 6) – Tropical Depression Six attains its peak intensity with a minimum barometric pressure of 1,002 mbar (29.6 inHg).
  • 18:00 UTC (1:00 p.m. CDT) – Tropical Depression Six dissipates over the high terrain of Mexico.
  • August 8

  • 00:00 UTC (8:00 p.m. EDT August 7) – Tropical Depression Seven forms from an area of low pressure roughly 400 mi (645 km) west-southwest of the Cape Verde Islands.
  • 18:00 UTC (2:00 p.m. EDT) – Tropical Depression Seven intensifies into a tropical storm.
  • August 9

  • 18:00 UTC (1:00 p.m. CDT) – Tropical Depression Eight forms from an area of low pressure roughly 160 mi (255 km) east of La Pesca, Mexico or roughly 225 mi (360 km) southeast of Brownsville, Texas.
  • August 10

  • 12:00 UTC (7:00 a.m. CDT) – Tropical Depression Eight intensifies into Tropical Storm Gabrielle.
  • August 11

  • 00:00 UTC (8:00 p.m. EDT August 10) – Tropical Storm Felix intensifies into a Category 1 hurricane roughly 500 mi (805 km) east-northeast of the Leeward Islands.
  • 18:00 UTC (2:00 p.m. EDT) – Hurricane Felix rapidly intensifies into a Category 2 hurricane.
  • 20:00 UTC (3:00 p.m. CDT) – Tropical Storm Gabrielle reaches its peak intensity with winds of 70 mph (115 km/h) and a minimum barometric pressure of 988 mbar (29.2 inHg). Concurrently, the system makes landfall just south of La Pesca, Mexico at this intensity.
  • August 12

  • 00:00 UTC (8:00 p.m. EDT August 11) – Hurricane Felix rapidly intensifies into a Category 3 hurricane.
  • 00:00 UTC (7:00 p.m. CDT August 11) – Tropical Storm Gabrielle weakens to a tropical depression and dissipates south of the United States–Mexico border.
  • 12:00 UTC (8:00 a.m. EDT) – Hurricane Felix rapidly intensifies into a Category 4 hurricane.
  • 18:00 UTC (2:00 p.m. EDT) – Hurricane Felix attains its peak intensity with winds of 140 mph (225 km/h) and a minimum barometric pressure of 929 mbar (27.4 inHg).
  • August 13

  • 06:00 UTC (2:00 a.m. EDT) – Hurricane Felix weakens to a Category 3 hurricane.
  • 18:00 UTC (2:00 p.m. EDT) – Hurricane Felix weakens to a Category 2 hurricane.
  • August 14

  • 06:00 UTC (2:00 a.m. EDT) – Hurricane Felix weakens to a Category 1 hurricane.
  • August 20

  • 06:00 UTC (2:00 a.m. EDT) – Hurricane Felix weakens to a tropical storm.
  • August 22

  • 00:00 UTC (8:00 p.m. EDT August 21) – Tropical Depression Nine forms from an area of low pressure while situated about 575 mi (925 km) west-southwest of the Cape Verde Islands.
  • 06:00 UTC (2:00 a.m. EDT) – Tropical Depression Nine intensifies into Tropical Storm Humberto.
  • 12:00 UTC (8:00 a.m. EDT) – Tropical Depression Ten forms from an area of low pressure roughly 600 mi (965 km) east of the Lesser Antilles.
  • 18:00 UTC (2:00 p.m. EDT) – Tropical Storm Felix transitions into an extratropical cyclone roughly 300 mi (485 km) east-northeast of Newfoundland.
  • 18:00 UTC (2:00 p.m. EDT) – Tropical Depression Ten intensifies into a Tropical Storm Iris.
  • 18:00 UTC (2:00 p.m. EDT) – Tropical Depression Eleven develops from an area of low pressure while located just southwest of Andros Island in the Bahamas.
  • August 23

  • 06:00 UTC (2:00 a.m. EDT) – Tropical Storm Humberto intensifies into a Category 1 hurricane.
  • 12:00 UTC (8:00 a.m. EDT) – Tropical Depression Eleven strengthens into Tropical Storm Jerry, while attaining its maximum sustained wind speed of 40 mph (65 km/h).
  • 18:00 UTC (2:00 p.m. EDT) – Tropical Storm Iris intensifies into a Category 1 hurricane.
  • 18:00 UTC (2:00 p.m. EDT) – Tropical Storm Jerry makes landfall near Jupiter, Florida with winds of 40 mph (65 km/h).
  • August 24

  • 18:00 UTC (2:00 p.m. EDT) – Hurricane Humberto reaches its peak intensity with maximum sustained winds of 110 mph (175 km/h) and a minimum barometric pressure of 968 mbar (28.6 inHg).
  • 18:00 UTC (2:00 p.m. EDT) – Hurricane Iris weakens to a tropical storm.
  • 18:00 UTC (2:00 p.m. EDT) – Tropical Storm Jerry attains its minimum barometric pressure of 1,002 mbar (29.6 inHg), while weakening to a tropical depression.
  • August 26

  • 12:00 UTC (8:00 a.m. EDT) – Tropical Depression Twelve develops from an area of low pressure while centered about 575 mi (925 km) west of the Cape Verde Islands.
  • 18:00 UTC (2:00 p.m. EDT) – Hurricane Humberto weakens to a Category 1 hurricane.
  • August 27

  • 12:00 UTC (8:00 a.m. EDT) – Tropical Depression Thirteen develops from an area of low pressure while located approximately 255 mi (410 km) south-southeast of Praia, Cape Verde.
  • 18:00 UTC (2:00 p.m. EDT) – Tropical Storm Iris makes landfall near Montserrat, Antigua with winds of 60 mph (95 km/h).
  • 23:00 UTC (7:00 p.m. EDT) – Tropical Storm Iris makes landfall on Barbuda with winds of 65 mph (105 km/h).
  • August 28

  • 06:00 UTC (2:00 a.m. EDT) – Tropical Depression Jerry merges with a trough while situated near the Georgia–South Carolina state line.
  • 06:00 UTC (2:00 a.m. EDT) – Tropical Depression Twelve strengthens into Tropical Storm Karen.
  • 18:00 UTC (2:00 p.m. EDT) – Tropical Storm Iris re-intensifies into a Category 1 hurricane.
  • August 29

  • 00:00 UTC (8:00 p.m. EDT August 28) – Tropical Storm Karen attains its peak intensity with maximum sustained winds of 50 mph (85 km/h) and a minimum barometric pressure of 1,000 mbar (30 inHg).
  • 00:00 UTC (8:00 p.m. EDT August 28) – Tropical Depression Thirteen intensifies into Tropical Storm Luis.
  • August 30

  • 18:00 UTC (2:00 p.m. EDT) – Tropical Storm Luis intensifies into a Category 1 hurricane.
  • August 31

  • 12:00 UTC (8:00 a.m. EDT) – Hurricane Luis intensifies into a Category 2 hurricane.
  • 18:00 UTC (2:00 p.m. EDT) – Hurricane Humberto weakens to a tropical storm.
  • September

    September 1

  • 00:00 UTC (8:00 p.m. EDT August 31) – Hurricane Luis intensifies into a Category 3 hurricane.
  • 06:00 UTC (2:00 a.m. EDT) – Tropical Storm Humberto becomes absorbed within a larger extratropical low.
  • 06:00 UTC (2:00 a.m. EDT) – Hurricane Iris reaches its peak intensity with winds of 110 mph (175 km/h) and a minimum barometric pressure of 965 mbar (28.5 inHg).
  • 12:00 UTC (8:00 a.m. EDT) – Hurricane Luis intensifies into a Category 4 hurricane.
  • September 2

  • 12:00 UTC (8:00 a.m. EDT) – Hurricane Iris weakens to a Category 1 hurricane.
  • 12:00 UTC (8:00 a.m. EDT) – Tropical Storm Karen weakens to a tropical depression.
  • September 3

  • 06:00 UTC (2:00 a.m. EDT) – Tropical Depression Karen is absorbed by Hurricane Iris.
  • 06:00 UTC (2:00 a.m. EDT) – Hurricane Luis attains its maximum sustained wind speed of 140 mph (220 km/h).
  • September 4

  • 06:00 UTC (2:00 a.m. EDT) – Hurricane Iris weakens to a tropical storm.
  • 12:00 UTC (8:00 a.m. EDT) – Tropical Storm Iris transitions into an extratropical cyclone while centered southeast of Newfoundland.
  • September 5

  • 12:00 UTC (8:00 a.m. EDT) – Hurricane Luis strikes Barbuda with winds of 130 mph (215 km/h).
  • September 7

  • 18:00 UTC (2:00 p.m. EDT) – Hurricane Luis weakens to a Category 3 hurricane.
  • September 8

  • 00:00 UTC (8:00 p.m. EDT September 7) – Hurricane Luis attains its minimum barometric pressure of 935 mbar (27.6 inHg).
  • September 9

  • 00:00 UTC (8:00 p.m. EDT September 8) – Hurricane Luis weakens to a Category 2 hurricane.
  • 12:00 UTC (8:00 a.m. EDT) – Tropical Depression Fourteen develops about halfway between the Cape Verde Islands and the Lesser Antilles.
  • September 10

  • 12:00 UTC (8:00 a.m. EDT) – Hurricane Luis weakens to a Category 1 hurricane
  • September 11

  • 12:00 UTC (8:00 a.m. EDT) – Hurricane Luis makes landfall on the Avalon Peninsula on Newfoundland with winds of 90 mph (150 km/h).
  • 18:00 UTC (2:00 p.m. EDT) – Hurricane Luis transitions into an extratropical cyclone while located northeast of Newfoundland.
  • September 12

  • 18:00 UTC (2:00 p.m. EDT) – Tropical Depression Fifteen develops from an area of low pressure while situated roughly 585 mi (940 km) east-southeast of Barbados.
  • September 13

  • 00:00 UTC (8:00 p.m. EDT September 12) – Tropical Depression Fifteen strengthens into Tropical Storm Marilyn.
  • 18:00 UTC (2:00 p.m. EDT) – Tropical Depression Fourteen dissipates about 495 mi (795 km) south-southeast of Bermuda.
  • September 14

  • 00:00 UTC (8:00 p.m. EDT September 13) – Tropical Storm Marilyn strengthens into a Category 1 hurricane.
  • 21:00 UTC (5:00 p.m. EDT) – Hurricane Marilyn makes landfall in Dominica with winds of 80 mph (130 km/h).
  • September 15

  • 18:00 UTC (2:00 p.m. EDT) – Hurricane Marilyn strengthens into a Category 2 hurricane.
  • September 16

  • 18:00 UTC (2:00 p.m. EDT) – Hurricane Marilyn strengthens into a Category 3 hurricane.
  • September 17

  • 03:00 UTC (11:00 p.m. EDT September 16) – Hurricane Marilyn attains its peak intensity with maximum sustained winds of 115 mph (185 km/h) and a minimum barometric pressure of 949 mbar (28.0 inHg).
  • 06:00 UTC (2:00 a.m. EDT) – Hurricane Marilyn weakens to a Category 2 hurricane.
  • 12:00 UTC (8:00 a.m. EDT) – Hurricane Marilyn weakens to a Category 1 hurricane.
  • September 18

  • 00:00 UTC (8:00 p.m. EDT September 17) – Hurricane Marilyn re-strengthens into a Category 2 hurricane.
  • 18:00 UTC (2:00 p.m. EDT) – Hurricane Marilyn weakens to a Category 1 hurricane.
  • September 21

  • 18:00 UTC (2:00 p.m. EDT) – Hurricane Marilyn weakens to a tropical storm.
  • September 22

  • 06:00 UTC (2:00 a.m. EDT) – Tropical Storm Marilyn transitions into an extratropical cyclone while located about 490 mi (790 km) south-southwest of Saint Pierre and Miquelon.
  • September 26

  • 18:00 UTC (2:00 p.m. EDT) – Tropical Depression Sixteen develops from an area of low pressure while centered about 930 mi (1,495 km) west-southwest of the Cape Verde Island.
  • September 27

  • 12:00 UTC (8:00 a.m. EDT) – Tropical Depression Sixteen intensifies into Tropical Storm Noel.
  • 18:00 UTC (1:00 p.m. CDT) – Tropical Depression Seventeen develops from an area of low pressure while situated about 80 mi (130 km) south-southeast of Cozumel, Quintana Roo.
  • September 28

  • 00:00 UTC (8:00 p.m. EDT September 27) – Tropical Depression Seventeen makes landfall in a rural area of Felipe Carrillo Puerto, Quintana Roo with winds of 30 mph (45 km/h).
  • 18:00 UTC (2:00 p.m. EDT) – Tropical Storm Noel intensifies into a Category 1 hurricane and attains its peak intensity with maximum sustained winds of 75 mph (120 km/h) and a minimum barometric pressure of 987 mbar (29.1 inHg).
  • September 30

  • 12:00 UTC (8:00 a.m. EDT) – Hurricane Noel weakens to a tropical storm.
  • 12:00 UTC (8:00 a.m. EDT) – Tropical Depression Seventeen strengthens into Tropical Storm Opal while approaching the northern coast of the Gulf of Mexico.
  • October

    October 2

  • 12:00 UTC (7:00 a.m. CDT) – Tropical Storm Opal strengthens into a Category 1 hurricane.
  • October 3

  • 18:00 UTC (1:00 p.m. CDT) – Hurricane Opal strengthens into a Category 2 hurricane.
  • October 4

  • 00:00 UTC (7:00 p.m. CDT October 3) – Hurricane Opal strengthens into a Category 3 hurricane.
  • 10:00 UTC (5:00 a.m. CDT) – Hurricane Opal strengthens into a Category 4 hurricane, while reaching its peak intensity with maximum sustained winds of 150 mph (240 km/h) and a minimum barometric pressure of 916 mbar (27.0 inHg).
  • 18:00 UTC (1:00 p.m. CDT) – Hurricane Opal weakens to a Category 3 hurricane.
  • 18:00 UTC (2:00 p.m. EDT) – Tropical Depression Eighteen develops from an area of low pressure while situated approximately 690 mi (1,110 km).
  • 22:00 UTC (5:00 p.m. CDT) – Hurricane Opal makes landfall near Pensacola Beach, Florida with winds of 115 mph (185 km/h).
  • October 5

  • 00:00 UTC (8:00 p.m. EDT October 4) – Tropical Storm Noel re-intensifies into a Category 1 hurricane and again attains its peak intensity with maximum sustained winds of 75 mph (120 km/h) and a minimum barometric pressure of 987 mbar (29.1 inHg).
  • 00:00 UTC (7:00 p.m. CDT October 4) – Hurricane Opal rapidly weakens to a Category 1 hurricane.
  • 06:00 UTC (1:00 a.m. CDT) – Hurricane Opal weakens to a tropical storm.
  • 12:00 UTC (7:00 a.m. CDT) – Tropical Storm Opal weakens to a tropical depression.
  • 12:00 UTC (8:00 a.m. EDT) – Tropical Depression Eighteen strengthens into Tropical Storm Pablo.
  • 18:00 UTC (2:00 p.m. EDT) – Tropical Depression Opal transitions into an extratropical cyclone while located over northeastern Kentucky.
  • October 6

  • 00:00 UTC (8:00 p.m. EDT October 5) – Hurricane Noel weakens to a tropical storm.
  • 06:00 UTC (2:00 a.m. EDT) – Tropical Storm Pablo attains its peak intensity with maximum sustained winds of 60 mph (95 km/h) and a minimum barometric pressure of 994 mbar (29.4 inHg).
  • October 7

  • 06:00 UTC (2:00 a.m. EDT) – Tropical Storm Noel transitions into an extratropical cyclone while located about 340 mi (545 km) southwest of Pico Island in the Azores.
  • 18:00 UTC (2:00 p.m. EDT) – Tropical Depression Nineteen develops from a complex combination of several synoptic-scale features while located just east of Nicaragua.
  • October 8

  • 12:00 UTC (8:00 a.m. EDT) – Tropical Storm Pablo weakens to a tropical depression.
  • 18:00 UTC (2:00 p.m. EDT) – Tropical Depression Pablo dissipates while located east-southeast of Barbados.
  • October 9

  • 00:00 UTC (8:00 p.m. EDT October 8) – Tropical Depression Nineteen intensifies into Tropical Storm Roxanne.
  • October 10

  • 06:00 UTC (1:00 a.m. CDT) – Tropical Storm Roxanne intensifies into a Category 1 hurricane.
  • 18:00 UTC (1:00 p.m. CDT) – Hurricane Roxanne intensifies into a Category 2 hurricane.
  • 21:52 UTC (4:52 p.m. CDT) – Hurricane Roxanne intensifies into a Category 3 hurricane while simultaneously attaining its peak intensity with winds of 115 mph (185 km/h) and a minimum barometric pressure of 956 mbar (28.2 inHg).
  • October 11

  • 02:00 UTC (9:00 p.m. CDT October 10) – Hurricane Roxanne makes landfall near Tulum, Quintana Roo with winds of 115 mph (185 km/h).
  • 06:00 UTC (1:00 a.m. CDT) – Hurricane Roxanne weakens to a Category 2 hurricane.
  • 12:00 UTC (7:00 a.m. CDT) – Hurricane Roxanne weakens to a Category 1 hurricane.
  • October 12

  • 12:00 UTC (7:00 a.m. CDT) – Hurricane Roxanne weakens to a tropical storm.
  • October 14

  • 12:00 UTC (7:00 a.m. CDT) – Tropical Storm Roxanne re-intensifies into a Category 1 hurricane.
  • October 17

  • 06:00 UTC (1:00 a.m. CDT) – Hurricane Roxanne weakens to a tropical storm.
  • October 19

  • 00:00 UTC (7:00 p.m. CDT October 18) – Tropical Storm Roxanne weakens to a tropical depression.
  • October 20

  • 12:00 UTC (7:00 a.m. CDT) – Tropical Depression Twenty develops from an area of low pressure while located about 380 mi (610 km) east-northeast of Barbados.
  • October 21

  • 00:00 UTC (7:00 p.m. CDT October 20) – Tropical Depression Roxanne dissipates offshore Veracruz.
  • 00:00 UTC (8:00 p.m. EDT October 20) – Tropical Depression Twenty strengthens into Tropical Storm Sebastien.
  • October 22

  • 18:00 UTC (2:00 p.m. EDT) – Tropical Storm Sebastien attains its peak intensity with maximum sustained winds of 65 mph (100 km/h) and a minimum barometric pressure of 1,001 mbar (29.6 inHg).
  • October 24

  • 00:00 UTC (8:00 p.m. EDT October 23) – Tropical Storm Sebastien weakens to a tropical depression.
  • 07:00 UTC (3:00 a.m. EDT) – Tropical Depression Sebastien makes landfall on Anguilla with winds of 35 mph (55 km/h).
  • October 25

  • 00:00 UTC (8:00 p.m. EDT October 24) – Tropical Depression Sebastien dissipates near Saint Croix, U.S. Virgin Islands.
  • October 27

  • 00:00 UTC (8:00 p.m. EDT October 26) – Tropical Depression Twenty-One develops from an area of low pressure while located about 500 mi (800 km) northeast of Anguilla.
  • 12:00 UTC (8:00 a.m. EDT) – Tropical Depression Twenty-One strengthens into Tropical Storm Tanya.
  • October 29

  • 12:00 UTC (8:00 a.m. EDT) – Tropical Storm Tanya strengthens into a Category 1 hurricane.
  • October 31'

  • 06:00 UTC (2:00 a.m. EDT) – Hurricane Tanya attains its peak intensity with maximum sustained winds of 85 mph (140 km/h) and a minimum barometric pressure of 972 mbar (28.7 inHg).
  • November

    November 1

  • 12:00 UTC (8:00 a.m. EDT) – Hurricane Tanya weakens to a tropical storm.
  • November 2

  • 00:00 UTC (8:00 p.m. EDT November 1) – Tropical Storm Tanya transitions into an extratropical cyclone while located about 10 mi (15 km) northwest of Graciosa in the Azores.
  • November 30

  • 23:59 UTC (7:59 p.m. EDT) – The 1995 Atlantic hurricane season official ends.
  • References

    Timeline of the 1995 Atlantic hurricane season Wikipedia