
 | ||
History of statistics
The history of statistics can be said to start around 1749 although, over time, there have been changes to the interpretation of the word statistics. In early times, the meaning was restricted to information about states. This was later extended to include all collections of information of all types, and later still it was extended to include the analysis and interpretation of such data. In modern terms, "statistics" means both sets of collected information, as in national accounts and temperature records, and analytical work which requires statistical inference.
Contents
- History of statistics
- A day without statistics
- Introduction
- Etymology
- Origins in probability theory
- Development of modern statistics
- Design of experiments
- Bayesian statistics
- References
Statistical activities are often associated with models expressed using probabilities, and require probability theory for them to be put on a firm theoretical basis: see history of probability.
A number of statistical concepts have an important impact on a wide range of sciences. These include the design of experiments and approaches to statistical inference such as Bayesian inference, each of which can be considered to have their own sequence in the development of the ideas underlying modern statistics.
A day without statistics
Introduction
By the 18th century, the term "statistics" designated the systematic collection of demographic and economic data by states. For at least two millennia, these data were mainly tabulations of human and material resources that might be taxed or put to military use. In the early 19th century, collection intensified, and the meaning of "statistics" broadened to include the discipline concerned with the collection, summary, and analysis of data. Today, data are collected and statistics are computed and widely distributed in government, business, most of the sciences and sports, and even for many pastimes. Electronic computers have expedited more elaborate statistical computation even as they have facilitated the collection and aggregation of data. A single data analyst may have available a set of data-files with millions of records, each with dozens or hundreds of separate measurements. These were collected over time from computer activity (for example, a stock exchange) or from computerized sensors, point-of-sale registers, and so on. Computers then produce simple, accurate summaries, and allow more tedious analyses, such as those that require inverting a large matrix or perform hundreds of steps of iteration, that would never be attempted by hand. Faster computing has allowed statisticians to develop "computer-intensive" methods which may look at all permutations, or use randomization to look at 10,000 permutations of a problem, to estimate answers that are not easy to quantify by theory alone..

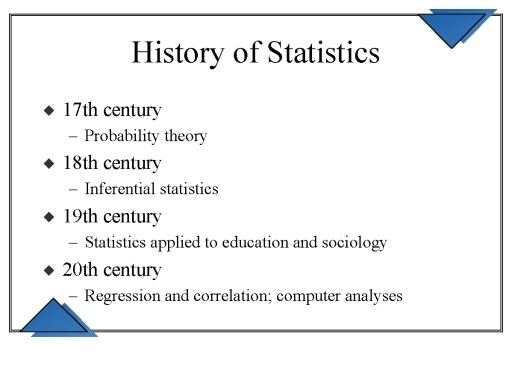
The term "mathematical statistics" designates the mathematical theories of probability and statistical inference, which are used in statistical practice. The relation between statistics and probability theory developed rather late, however. In the 19th century, statistics increasingly used probability theory, whose initial results were found in the 17th and 18th centuries, particularly in the analysis of games of chance (gambling). By 1800, astronomy used probability models and statistical theories, particularly the method of least squares. Early probability theory and statistics was systematized in the 19th century and statistical reasoning and probability models were used by social scientists to advance the new sciences of experimental psychology and sociology, and by physical scientists in thermodynamics and statistical mechanics. The development of statistical reasoning was closely associated with the development of inductive logic and the scientific method, which are concerns that move statisticians away from the narrower area of mathematical statistics. Much of the theoretical work was readily available by the time computers were available to exploit them. By the 1970s, Johnson and Kotz produced a four-volume Compendium on Statistical Distributions (First Edition 1969-1972), which is still an invaluable resource.
Applied statistics can be regarded as not a field of mathematics but an autonomous mathematical science, like computer science and operations research. Unlike mathematics, statistics had its origins in public administration. Applications arose early in demography and economics; large areas of micro- and macro-economics today are "statistics" with an emphasis on time-series analyses. With its emphasis on learning from data and making best predictions, statistics also has been shaped by areas of academic research including psychological testing, medicine and epidemiology. The ideas of statistical testing have considerable overlap with decision science. With its concerns with searching and effectively presenting data, statistics has overlap with information science and computer science.
Etymology
Look up statistics in Wiktionary, the free dictionary.The term statistics is ultimately derived from the New Latin statisticum collegium ("council of state") and the Italian word statista ("statesman" or "politician"). The German Statistik, first introduced by Gottfried Achenwall (1749), originally designated the analysis of data about the state, signifying the "science of state" (then called political arithmetic in English). It acquired the meaning of the collection and classification of data generally in the early 19th century. It was introduced into English in 1791 by Sir John Sinclair when he published the first of 21 volumes titled Statistical Account of Scotland.
Thus, the original principal purpose of Statistik was data to be used by governmental and (often centralized) administrative bodies. The collection of data about states and localities continues, largely through national and international statistical services. In particular, censuses provide frequently updated information about the population.
The first book to have 'statistics' in its title was "Contributions to Vital Statistics" (1845) by Francis GP Neison, actuary to the Medical Invalid and General Life Office.
Origins in probability theory
Basic forms of statistics have been used since the beginning of civilization. Early empires often collated censuses of the population or recorded the trade in various commodities. The Roman Empire was one of the first states to extensively gather data on the size of the empire's population, geographical area and wealth.
The use of statistical methods dates back to least to the 5th century BCE. The historian Thucydides in his History of the Peloponnesian War describes how the Athenians calculated the height of the wall of Platea by counting the number of bricks in an unplastered section of the wall sufficiently near them to be able to count them. The count was repeated several times by a number of soldiers. The most frequent value (in modern terminology - the mode ) so determined was taken to be the most likely value of the number of bricks. Multiplying this value by the height of the bricks used in the wall allowed the Athenians to determine the height of the ladders necessary to scale the walls.
In the Indian epic - the Mahabharata (Book 3: The Story of Nala) - King Rtuparna estimated the number of fruit and leaves (2095 fruit and 50,000,000 - five crores - leaves) on two great branches of a Vibhitaka tree by counting them on a single twig. This number was then multiplied by the number of twigs on the branches. This estimate was later checked and found to be very close to the actual number. With knowledge of this method Nala was subsequently able to regain his kingdom.
The earliest writing on statistics was found in a 9th-century book entitled: "Manuscript on Deciphering Cryptographic Messages", written by Al-Kindi (801–873 CE). In his book, Al-Kindi gave a detailed description of how to use statistics and frequency analysis to decipher encrypted messages. This text arguably gave rise to the birth of both statistics and cryptanalysis.
The Trial of the Pyx is a test of the purity of the coinage of the Royal Mint which has been held on a regular basis since the 12th century. The Trial itself is based on statistical sampling methods. After minting a series of coins - originally from ten pounds of silver - a single coin was placed in the Pyx - a box in Westminster Abbey. After a given period - now once a year - the coins are removed and weighed. A sample of coins removed from the box are then tested for purity.
The Nuova Cronica, a 14th-century history of Florence by the Florentine banker and official Giovanni Villani, includes much statistical information on population, ordinances, commerce and trade, education, and religious facilities and has been described as the first introduction of statistics as a positive element in history, though neither the term nor the concept of statistics as a specific field yet existed. But this was proven to be incorrect after the rediscovery of Al-Kindi's book on frequency analysis.
The arithmetic mean, although a concept known to the Greeks, was not generalised to more than two values until the 16th century. The invention of the decimal system by Simon Stevin in 1585 seems likely to have facilitated these calculations. This method was first adopted in astronomy by Tycho Brahe who was attempting to reduce the errors in his estimates of the locations of various celestial bodies.
The idea of the median originated in Edward Wright's book on navigation (Certaine Errors in Navigation) in 1599 in a section concerning the determination of location with a compass. Wright felt that this value was the most likely to be the correct value in a series of observations.
The birth of statistics is often dated to 1662, when John Graunt, along with William Petty, developed early human statistical and census methods that provided a framework for modern demography. He produced the first life table, giving probabilities of survival to each age. His book Natural and Political Observations Made upon the Bills of mortality used analysis of the mortality rolls to make the first statistically based estimation of the population of London. He knew that there were around 13,000 funerals per year in London and that three people died per eleven families per year. He estimated from the parish records that the average family size was 8 and calculated that the population of London was about 384,000. Laplace in 1802 estimated the population of France with a similar method.
Although the original scope of statistics was limited to data useful for governance, the approach was extended to many fields of a scientific or commercial nature during the 19th century. The mathematical foundations for the subject heavily drew on the new probability theory, pioneered in the 16th century in the correspondence amongst Gerolamo Cardano, Pierre de Fermat and Blaise Pascal. Christiaan Huygens (1657) gave the earliest known scientific treatment of the subject. Jakob Bernoulli's Ars Conjectandi (posthumous, 1713) and Abraham de Moivre's The Doctrine of Chances (1718) treated the subject as a branch of mathematics. In his book Bernoulli introduced the idea of representing complete certainty as one and probability as a number between zero and one.
The formal study of theory of errors may be traced back to Roger Cotes' Opera Miscellanea (posthumous, 1722), but a memoir prepared by Thomas Simpson in 1755 (printed 1756) first applied the theory to the discussion of errors of observation. The reprint (1757) of this memoir lays down the axioms that positive and negative errors are equally probable, and that there are certain assignable limits within which all errors may be supposed to fall; continuous errors are discussed and a probability curve is given. Simpson discussed several possible distributions of error. He first considered the uniform distribution and then the discrete symmetric triangular distribution followed by the continuous symmetric triangle distribution. Tobias Mayer, in his study of the libration of the moon (Kosmographische Nachrichten, Nuremberg, 1750), invented the first formal method for estimating the unknown quantities by generalized the averaging of observations under identical circumstances to the averaging of groups of similar equations.
Ruder Boškovic in 1755 based in his work on the shape of the earth proposed in his book De Litteraria expeditione per pontificiam ditionem ad dimetiendos duos meridiani gradus a PP. Maire et Boscovicli that the true value of a series of observations would be that which minimises the sum of absolute errors. In modern terminology this value is the median. The first example of what later became known as the normal curve was studied by Abraham de Moivre who plotted this curve on November 12, 1733. de Moivre was studying the number of heads that occurred when a 'fair' coin was tossed.
In 1761 Thomas Bayes proved Bayes' theorem and in 1765 Joseph Priestley invented the first timeline charts.
Johann Heinrich Lambert in his 1765 book Anlage zur Architectonic proposed the semicircle as a distribution of errors:
with -1 < x < 1.
Pierre-Simon Laplace (1774) made the first attempt to deduce a rule for the combination of observations from the principles of the theory of probabilities. He represented the law of probability of errors by a curve and deduced a formula for the mean of three observations.
Laplace in 1774 noted that the frequency of an error could be expressed as an exponential function of its magnitude once its sign was disregarded. This distribution is now known as the Laplace distribution. Lagrange proposed a parabolic distribution of errors in 1776.
Laplace in 1778 published his second law of errors wherein he noted that the frequency of an error was proportional to the exponential of the square of its magnitude. This was subsequently rediscovered by Gauss (possibly in 1795) and is now best known as the normal distribution which is of central importance in statistics. This distribution was first referred to as the normal distribution by Pierce in 1873 who was studying measurement errors when an object was dropped onto a wooden base. He chose the term normal because of its frequent occurrence in naturally occurring variables.
Lagrange also suggested in 1781 two other distributions for errors - a raised cosine distribution and a logarithmic distribution.
Laplace gave (1781) a formula for the law of facility of error (a term due to Joseph Louis Lagrange, 1774), but one which led to unmanageable equations. Daniel Bernoulli (1778) introduced the principle of the maximum product of the probabilities of a system of concurrent errors.
In 1786 William Playfair (1759-1823) introduced the idea of graphical representation into statistics. He invented the line chart, bar chart and histogram and incorporated them into his works on economics, the Commercial and Political Atlas. This was followed in 1795 by his invention of the pie chart and circle chart which he used to display the evolution of England's imports and exports. These latter charts came to general attention when he published examples in his Statistical Breviary in 1801.
Laplace, in an investigation of the motions of Saturn and Jupiter in 1787, generalized Mayer's method by using different linear combinations of a single group of equations.
In 1802 Laplace estimated the population of France to be 28,328,612. He calculated this figure using the number of births in the previous year and census data for three communities. The census data of these communities showed that they had 2,037,615 persons and that the number of births were 71,866. Assuming that these samples were representative of France, Laplace produced his estimate for the entire population.
The method of least squares, which was used to minimize errors in data measurement, was published independently by Adrien-Marie Legendre (1805), Robert Adrain (1808), and Carl Friedrich Gauss (1809). Gauss had used the method in his famous 1801 prediction of the location of the dwarf planet Ceres. The observations that Gauss based his calculations on were made by the Italian monk Piazzi.
The term probable error (der wahrscheinliche Fehler) - the median deviation from the mean - was introduced in 1815 by the German astronomer Frederik Wilhelm Bessel. Antoine Augustin Cournot in 1843 was the first to use the term median (valeur médiane) for the value that divides a probability distribution into two equal halves.
Other contributors to the theory of errors were Ellis (1844), De Morgan (1864), Glaisher (1872), and Giovanni Schiaparelli (1875). Peters's (1856) formula for
In the 19th century authors on statistical theory included Laplace, S. Lacroix (1816), Littrow (1833), Dedekind (1860), Helmert (1872), Laurent (1873), Liagre, Didion, De Morgan and Boole.
Gustav Theodor Fechner used the median (Centralwerth) in sociological and psychological phenomena. It had earlier been used only in astronomy and related fields. Francis Galton used the English term median for the first time in 1881 having earlier used the terms middle-most value in 1869 and the medium in 1880.
Adolphe Quetelet (1796–1874), another important founder of statistics, introduced the notion of the "average man" (l'homme moyen) as a means of understanding complex social phenomena such as crime rates, marriage rates, and suicide rates.
The first tests of the normal distribution were invented by the German statistician Wilhelm Lexis in the 1870s. The only data sets available to him that he was able to show were normally distributed were birth rates.
Development of modern statistics
Although the origins of statistical theory lie in the 18th century advances in probability, the modern field of statistics only emerged in the late 19th and early 20th century in three stages. The first wave, at the turn of the century, was led by the work of Francis Galton and Karl Pearson, who transformed statistics into a rigorous mathematical discipline used for analysis, not just in science, but in industry and politics as well. The second wave of the 1910s and 20s was initiated by William Gosset, and reached its culmination in the insights of Ronald Fisher. This involved the development of better design of experiments models, hypothesis testing and techniques for use with small data samples. The final wave, which mainly saw the refinement and expansion of earlier developments, emerged from the collaborative work between Egon Pearson and Jerzy Neyman in the 1930s. Today, statistical methods are applied in all fields that involve decision making, for making accurate inferences from a collated body of data and for making decisions in the face of uncertainty based on statistical methodology.
The first statistical bodies were established in the early 19th century. The Royal Statistical Society was founded in 1834 and Florence Nightingale, its first female member, pioneered the application of statistical analysis to health problems for the furtherance of epidemiological understanding and public health practice. However, the methods then used would not be considered as modern statistics today.
The Oxford scholar Francis Ysidro Edgeworth's book, Metretike: or The Method of Measuring Probability and Utility (1887) dealt with probability as the basis of inductive reasoning, and his later works focused on the 'philosophy of chance'. His first paper on statistics (1883) explored the law of error (normal distribution), and his Methods of Statistics (1885) introduced an early version of the t distribution, the Edgeworth expansion, the Edgeworth series, the method of variate transformation and the asymptotic theory of maximum likelihood estimates.
The Norwegian Anders Nicolai Kiær introduced the concept of stratified sampling in 1895. Arthur Lyon Bowley introduced new methods of data sampling in 1906 when working on social statistics. Although statistical surveys of social conditions had started with Charles Booth's "Life and Labour of the People in London" (1889-1903) and Seebohm Rowntree's "Poverty, A Study of Town Life" (1901), Bowley's, key innovation consisted of the use of random sampling techniques. His efforts culminated in his New Survey of London Life and Labour.
Francis Galton is credited as one of the principal founders of statistical theory. His contributions to the field included introducing the concepts of standard deviation, correlation, regression and the application of these methods to the study of the variety of human characteristics - height, weight, eyelash length among others. He found that many of these could be fitted to a normal curve distribution.
Galton submitted a paper to Nature in 1907 on the usefulness of the median. He examined the accuracy of 787 guesses of the weight of an ox at a country fair. The actual weight was 1208 pounds: the median guess was 1198. The guesses were markedly non-normally distributed.
Galton's publication of Natural Inheritance in 1889 sparked the interest of a brilliant mathematician, Karl Pearson, then working at University College London, and he went on to found the discipline of mathematical statistics. He emphasised the statistical foundation of scientific laws and promoted its study and his laboratory attracted students from around the world attracted by his new methods of analysis, including Udny Yule. His work grew to encompass the fields of biology, epidemiology, anthropometry, medicine and social history. In 1901, with Walter Weldon, founder of biometry, and Galton, he founded the journal Biometrika as the first journal of mathematical statistics and biometry.
His work, and that of Galton's, underpins many of the 'classical' statistical methods which are in common use today, including the Correlation coefficient, defined as a product-moment; the method of moments for the fitting of distributions to samples; Pearson's system of continuous curves that forms the basis of the now conventional continuous probability distributions; Chi distance a precursor and special case of the Mahalanobis distance and p-value, defined as the probability measure of the complement of the ball with the hypothesized value as center point and chi distance as radius. He also introduced the term 'standard deviation'.
He also founded the statistical hypothesis testing theory, Pearson's chi-squared test and principal component analysis. In 1911 he founded the world's first university statistics department at University College London.
The second wave of mathematical statistics was pioneered by Ronald Fisher who wrote two textbooks, Statistical Methods for Research Workers, published in 1925 and The Design of Experiments in 1935, that were to define the academic discipline in universities around the world. He also systematized previous results, putting them on a firm mathematical footing. In his 1918 seminal paper The Correlation between Relatives on the Supposition of Mendelian Inheritance, the first use to use the statistical term, variance. In 1919, at Rothamsted Experimental Station he started a major study of the extensive collections of data recorded over many years. This resulted in a series of reports under the general title Studies in Crop Variation. In 1930 he published The Genetical Theory of Natural Selection where he applied statistics to evolution.
Over the next seven years, he pioneered the principles of The Design of Experiments (see below) and elaborated his studies of analysis of variance. He furthered his studies of the statistics of small samples. Perhaps even more important, he began his systematic approach of the analysis of real data as the springboard for the development of new statistical methods. He developed computational algorithms for analyzing data from his balanced experimental designs. In 1925, this work resulted in the publication of his first book, Statistical Methods for Research Workers. This book went through many editions and translations in later years, and it became the standard reference work for scientists in many disciplines. In 1935, this book was followed by The Design of Experiments, which was also widely used.
In addition to analysis of variance, Fisher named and promoted the method of maximum likelihood estimation. Fisher also originated the concepts of sufficiency, ancillary statistics, Fisher's linear discriminator and Fisher information. His article On a distribution yielding the error functions of several well known statistics (1924) presented Pearson's chi-squared test and William Gosset's t in the same framework as the Gaussian distribution, and his own parameter in the analysis of variance Fisher's z-distribution (more commonly used decades later in the form of the F distribution). The 5% level of significance appears to have been introduced by Fisher in 1925. Fisher stated that deviations exceeding twice the standard deviation are regarded as significant. Before this deviations exceeding three times the probable error were considered significant. For a symmetrical distribution the probable error is half the interquartile range. For a normal distribution the probable error is approximately 2/3 the standard deviation. It appears that Fisher's 5% criterion was rooted in previous practice.
Other important contributions at this time included Charles Spearman's rank correlation coefficient that was a useful extension of the Pearson correlation coefficient. William Sealy Gosset, the English statistician better known under his pseudonym of Student, introduced Student's t-distribution, a continuous probability distribution useful in situations where the sample size is small and population standard deviation is unknown.
Egon Pearson (Karl's son) and Jerzy Neyman introduced the concepts of "Type II" error, power of a test and confidence intervals. Jerzy Neyman in 1934 showed that stratified random sampling was in general a better method of estimation than purposive (quota) sampling.
Design of experiments
In 1747, while serving as surgeon on HM Bark Salisbury, James Lind carried out a controlled experiment to develop a cure for scurvy. In this study his subjects' cases "were as similar as I could have them", that is he provided strict entry requirements to reduce extraneous variation. The men were paired, which provided blocking. From a modern perspective, the main thing that is missing is randomized allocation of subjects to treatments.
James Lind is today often described as a one-factor-at-a-time experimenter. Similar one-factor-at-a-time (OFAT) experimentation was performed at the Rothamsted Research Station in the 1840s by Sir John Lawes to determine the optimal inorganic fertilizer for use on wheat.
A theory of statistical inference was developed by Charles S. Peirce in "Illustrations of the Logic of Science" (1877–1878) and "A Theory of Probable Inference" (1883), two publications that emphasized the importance of randomization-based inference in statistics. In another study, Peirce randomly assigned volunteers to a blinded, repeated-measures design to evaluate their ability to discriminate weights.
Peirce's experiment inspired other researchers in psychology and education, which developed a research tradition of randomized experiments in laboratories and specialized textbooks in the 1800s. Peirce also contributed the first English-language publication on an optimal design for regression-models in 1876. A pioneering optimal design for polynomial regression was suggested by Gergonne in 1815. In 1918 Kirstine Smith published optimal designs for polynomials of degree six (and less).
The use of a sequence of experiments, where the design of each may depend on the results of previous experiments, including the possible decision to stop experimenting, was pioneered by Abraham Wald in the context of sequential tests of statistical hypotheses. Surveys are available of optimal sequential designs, and of adaptive designs. One specific type of sequential design is the "two-armed bandit", generalized to the multi-armed bandit, on which early work was done by Herbert Robbins in 1952.
The term "design of experiments" (DOE) derives from early statistical work performed by Sir Ronald Fisher. He was described by Anders Hald as "a genius who almost single-handedly created the foundations for modern statistical science." Fisher initiated the principles of design of experiments and elaborated on his studies of "analysis of variance". Perhaps even more important, Fisher began his systematic approach to the analysis of real data as the springboard for the development of new statistical methods. He began to pay particular attention to the labour involved in the necessary computations performed by hand, and developed methods that were as practical as they were founded in rigour. In 1925, this work culminated in the publication of his first book, Statistical Methods for Research Workers. This went into many editions and translations in later years, and became a standard reference work for scientists in many disciplines.
A methodology for designing experiments was proposed by Ronald A. Fisher, in his innovative book The Design of Experiments (1935) which also became a standard. As an example, he described how to test the hypothesis that a certain lady could distinguish by flavour alone whether the milk or the tea was first placed in the cup. While this sounds like a frivolous application, it allowed him to illustrate the most important ideas of experimental design: see Lady tasting tea.
Agricultural science advances served to meet the combination of larger city populations and fewer farms. But for crop scientists to take due account of widely differing geographical growing climates and needs, it was important to differentiate local growing conditions. To extrapolate experiments on local crops to a national scale, they had to extend crop sample testing economically to overall populations. As statistical methods advanced (primarily the efficacy of designed experiments instead of one-factor-at-a-time experimentation), representative factorial design of experiments began to enable the meaningful extension, by inference, of experimental sampling results to the population as a whole. But it was hard to decide how representative was the crop sample chosen. Factorial design methodology showed how to estimate and correct for any random variation within the sample and also in the data collection procedures.
Bayesian statistics
The term Bayesian refers to Thomas Bayes (1702–1761), who proved a special case of what is now called Bayes' theorem. However it was Pierre-Simon Laplace (1749–1827) who introduced a general version of the theorem and applied it to celestial mechanics, medical statistics, reliability, and jurisprudence. When insufficient knowledge was available to specify an informed prior, Laplace used uniform priors, according to his "principle of insufficient reason". Laplace assumed uniform priors for mathematical simplicity rather than for philosophical reasons. Laplace also introduced primitive versions of conjugate priors and the theorem of von Mises and Bernstein, according to which the posteriors corresponding to initially differing priors ultimately agree, as the number of observations increases. This early Bayesian inference, which used uniform priors following Laplace's principle of insufficient reason, was called "inverse probability" (because it infers backwards from observations to parameters, or from effects to causes).
After the 1920s, inverse probability was largely supplanted by a collection of methods that were developed by Ronald A. Fisher, Jerzy Neyman and Egon Pearson. Their methods came to be called frequentist statistics. Fisher rejected the Bayesian view, writing that "the theory of inverse probability is founded upon an error, and must be wholly rejected". At the end of his life, however, Fisher expressed greater respect for the essay of Bayes, which Fisher believed to have anticipated his own, fiducial approach to probability; Fisher still maintained that Laplace's views on probability were "fallacious rubbish". Neyman started out as a "quasi-Bayesian", but subsequently developed confidence intervals (a key method in frequentist statistics) because "the whole theory would look nicer if it were built from the start without reference to Bayesianism and priors". The word Bayesian appeared around 1950, and by the 1960s it became the term preferred by those dissatisfied with the limitations of frequentist statistics.
In the 20th century, the ideas of Laplace were further developed in two different directions, giving rise to objective and subjective currents in Bayesian practice. In the objectivist stream, the statistical analysis depends on only the model assumed and the data analysed. No subjective decisions need to be involved. In contrast, "subjectivist" statisticians deny the possibility of fully objective analysis for the general case.
In the further development of Laplace's ideas, subjective ideas predate objectivist positions. The idea that 'probability' should be interpreted as 'subjective degree of belief in a proposition' was proposed, for example, by John Maynard Keynes in the early 1920s. This idea was taken further by Bruno de Finetti in Italy (Fondamenti Logici del Ragionamento Probabilistico, 1930) and Frank Ramsey in Cambridge (The Foundations of Mathematics, 1931). The approach was devised to solve problems with the frequentist definition of probability but also with the earlier, objectivist approach of Laplace. The subjective Bayesian methods were further developed and popularized in the 1950s by L.J. Savage.
Objective Bayesian inference was further developed by Harold Jeffreys at the University of Cambridge. His seminal book "Theory of probability" first appeared in 1939 and played an important role in the revival of the Bayesian view of probability. In 1957, Edwin Jaynes promoted the concept of maximum entropy for constructing priors, which is an important principle in the formulation of objective methods, mainly for discrete problems. In 1965, Dennis Lindley's 2-volume work "Introduction to probability and statistics from a Bayesian Viewpoint" brought Bayesian methods to a wide audience. In 1979, José-Miguel Bernardo introduced reference analysis, which offers a general applicable framework for objective analysis. Other well-known proponents of Bayesian probability theory include I.J. Good, B.O. Koopman, Howard Raiffa, Robert Schlaifer and Alan Turing.
During the 1980s, the field of Bayesian methods witnessed significant expansion in both research and practical applications. This surge in popularity can largely be attributed to the advent of Markov chain Monte Carlo methods, which alleviated numerous computational challenges previously associated with Bayesian analysis. Concurrently, there was a growing interest in applying these methods to complex and nontraditional problems. Despite the increased focus on Bayesian research, the majority of undergraduate statistical education continues to emphasize frequentist approaches. Nonetheless, Bayesian methods are widely accepted and used, such as for example in the field of machine learning.