
 | ||
The Pearson distribution is a family of continuous probability distributions. It was first published by Karl Pearson in 1895 and subsequently extended by him in 1901 and 1916 in a series of articles on biostatistics.
Contents
- History
- Definition
- Case 1 negative discriminant The Pearson type IV distribution
- The Pearson type VII distribution
- Students t distribution
- Case 2 non negative discriminant
- The Pearson type I distribution
- The Pearson type II distribution
- The Pearson type III distribution
- The Pearson type V distribution
- The Pearson type VI distribution
- Relation to other distributions
- Applications
- References
History
The Pearson system was originally devised in an effort to model visibly skewed observations. It was well known at the time how to adjust a theoretical model to fit the first two cumulants or moments of observed data: Any probability distribution can be extended straightforwardly to form a location-scale family. Except in pathological cases, a location-scale family can be made to fit the observed mean (first cumulant) and variance (second cumulant) arbitrarily well. However, it was not known how to construct probability distributions in which the skewness (standardized third cumulant) and kurtosis (standardized fourth cumulant) could be adjusted equally freely. This need became apparent when trying to fit known theoretical models to observed data that exhibited skewness. Pearson's examples include survival data, which are usually asymmetric.
In his original paper, Pearson (1895, p. 360) identified four types of distributions (numbered I through IV) in addition to the normal distribution (which was originally known as type V). The classification depended on whether the distributions were supported on a bounded interval, on a half-line, or on the whole real line; and whether they were potentially skewed or necessarily symmetric. A second paper (Pearson 1901) fixed two omissions: it redefined the type V distribution (originally just the normal distribution, but now the inverse-gamma distribution) and introduced the type VI distribution. Together the first two papers cover the five main types of the Pearson system (I, III, IV, V, and VI). In a third paper, Pearson (1916) introduced further special cases and subtypes (VII through XII).
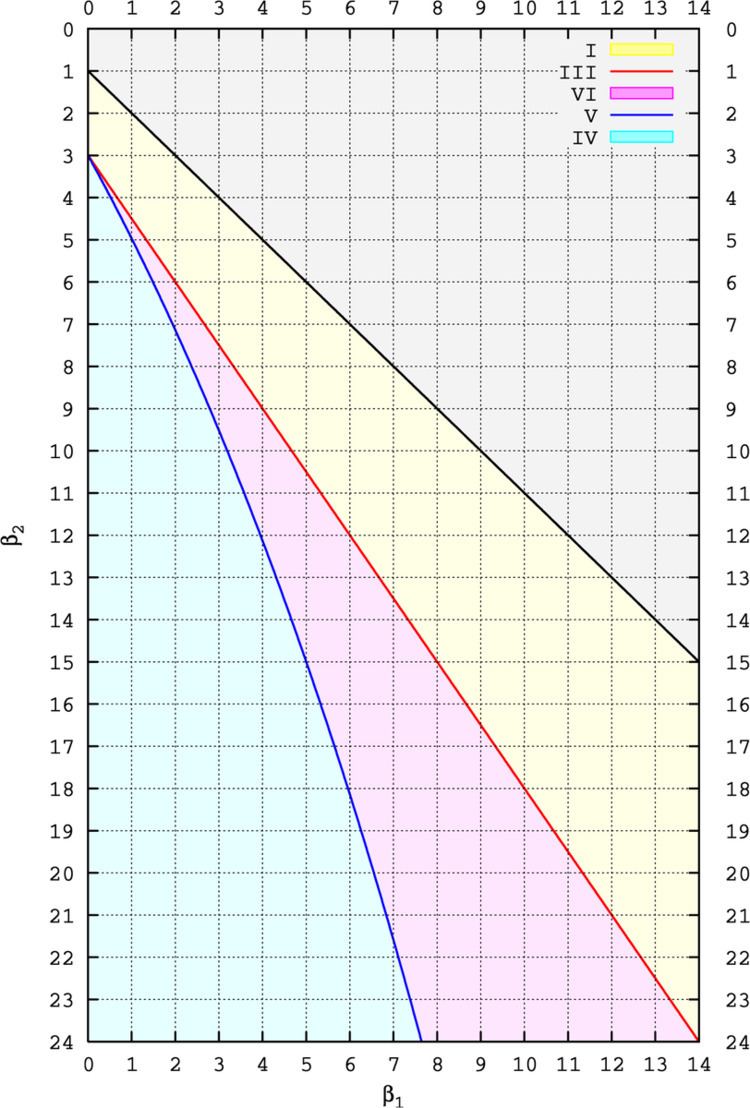
Rhind (1909, pp. 430–432) devised a simple way of visualizing the parameter space of the Pearson system, which was subsequently adopted by Pearson (1916, plate 1 and pp. 430ff., 448ff.). The Pearson types are characterized by two quantities, commonly referred to as β1 and β2. The first is the square of the skewness:
Many of the skewed and/or non-mesokurtic distributions familiar to us today were still unknown in the early 1890s. What is now known as the beta distribution had been used by Thomas Bayes as a posterior distribution of the parameter of a Bernoulli distribution in his 1763 work on inverse probability. The Beta distribution gained prominence due to its membership in Pearson's system and was known until the 1940s as the Pearson type I distribution. (Pearson's type II distribution is a special case of type I, but is usually no longer singled out.) The gamma distribution originated from Pearson's work (Pearson 1893, p. 331; Pearson 1895, pp. 357, 360, 373–376) and was known as the Pearson type III distribution, before acquiring its modern name in the 1930s and 1940s. Pearson's 1895 paper introduced the type IV distribution, which contains Student's t-distribution as a special case, predating William Sealy Gosset's subsequent use by several years. His 1901 paper introduced the inverse-gamma distribution (type V) and the beta prime distribution (type VI).
Definition
A Pearson density p is defined to be any valid solution to the differential equation (cf. Pearson 1895, p. 381)
with :
According to Ord, Pearson devised the underlying form of Equation (1) on the basis of, firstly, the formula for the derivative of the logarithm of the density function of the normal distribution (which gives a linear function) and, secondly, from a recurrence relation for values in the probability mass function of the hypergeometric distribution (which yields the linear-divided-by-quadratic structure).
In Equation (1), the parameter a determines a stationary point, and hence under some conditions a mode of the distribution, since
follows directly from the differential equation.
Since we are confronted with a first order linear differential equation with variable coefficients, its solution is straightforward:
The integral in this solution simplifies considerably when certain special cases of the integrand are considered. Pearson (1895, p. 367) distinguished two main cases, determined by the sign of the discriminant (and hence the number of real roots) of the quadratic function
Case 1, negative discriminant: The Pearson type IV distribution
If the discriminant of the quadratic function (2) is negative (
Observe that α is a well-defined real number and α ≠ 0, because by assumption
The absence of real roots is obvious from this formulation, because α2 is necessarily positive.
We now express the solution to the differential equation (1) as a function of y:
Pearson (1895, p. 362) called this the "trigonometrical case", because the integral
involves the inverse trigonometric arctan function. Then
Finally, let
Applying these substitutions, we obtain the parametric function:
This unnormalized density has support on the entire real line. It depends on a scale parameter α > 0 and shape parameters m > 1/2 and ν. One parameter was lost when we chose to find the solution to the differential equation (1) as a function of y rather than x. We therefore reintroduce a fourth parameter, namely the location parameter λ. We have thus derived the density of the Pearson type IV distribution:
The normalizing constant involves the complex Gamma function (Γ) and the Beta function (B).
The Pearson type VII distribution
The shape parameter ν of the Pearson type IV distribution controls its skewness. If we fix its value at zero, we obtain a symmetric three-parameter family. This special case is known as the Pearson type VII distribution (cf. Pearson 1916, p. 450). Its density is
where B is the Beta function.
An alternative parameterization (and slight specialization) of the type VII distribution is obtained by letting
which requires m > 3/2. This entails a minor loss of generality but ensures that the variance of the distribution exists and is equal to σ2. Now the parameter m only controls the kurtosis of the distribution. If m approaches infinity as λ and σ are held constant, the normal distribution arises as a special case:
This is the density of a normal distribution with mean λ and standard deviation σ.
It is convenient to require that m > 5/2 and to let
This is another specialization, and it guarantees that the first four moments of the distribution exist. More specifically, the Pearson type VII distribution parameterized in terms of (λ, σ, γ2) has a mean of λ, standard deviation of σ, skewness of zero, and excess kurtosis of γ2.
Student's t-distribution
The Pearson type VII distribution is equivalent to the non-standardized Student's t-distribution with parameters ν > 0, μ, σ2 by applying the following substitutions to its original parameterization:
Observe that the constraint m > 1/2 is satisfied.
The resulting density is
which is easily recognized as the density of a Student's t-distribution.
Note also that this implies that the Pearson type VII distribution subsumes the standard Student's t-distribution and also the standard Cauchy distribution. In particular, the standard Student's t-distribution arises as a subcase, when μ = 0 and σ2 = 1, equivalent to the following substitutitons:
The density of this restricted one-parameter family is a standard Student's t:
Case 2, non-negative discriminant
If the quadratic function (2) has a non-negative discriminant (
In the presence of real roots the quadratic function (2) can be written as
and the solution to the differential equation is therefore
Pearson (1895, p. 362) called this the "logarithmic case", because the integral
involves only the logarithm function, and not the arctan function as in the previous case.
Using the substitution
we obtain the following solution to the differential equation (1):
Since this density is only known up to a hidden constant of proportionality, that constant can be changed and the density written as follows:
The Pearson type I distribution
The Pearson type I distribution (a generalization of the beta distribution) arises when the roots of the quadratic equation (2) are of opposite sign, that is,
which yields a solution in terms of y that is supported on the interval (0, 1):
One may define:
Regrouping constants and parameters, this simplifies to:
Thus
It turns out that m1, m2 > −1 is necessary and sufficient for p to be a proper probability density function.
The Pearson type II distribution
The Pearson type II distribution is a special case of the Pearson type I family restricted to symmetric distributions.
For the Pearson Type II Curve,
where
the ordinate, y, is the frequency of
The moments of x used are
The Pearson type III distribution
The Pearson type III distribution is a gamma distribution or chi-squared distribution.
The Pearson type V distribution
Defining new parameters:
The Pearson type V distribution is an inverse-gamma distribution.
The Pearson type VI distribution
The Pearson type VI distribution is a beta prime distribution or F-distribution.
Relation to other distributions
The Pearson family subsumes the following distributions, among others:
Applications
These models are used in financial markets, given their ability to be parametrised in a way that has intuitive meaning for market traders. A number of models are in current use that capture the stochastic nature of the volatility of rates, stocks etc. and this family of distributions may prove to be one of the more important.
In the United States, the Log-Pearson III is the default distribution for flood frequency analysis.