
 | ||
Mathematical statistics is the application of mathematics to statistics, which was originally conceived as the science of the state — the collection and analysis of facts about a country: its economy, land, military, population, and so forth. Mathematical techniques which are used for this include mathematical analysis, linear algebra, stochastic analysis, differential equations, and measure-theoretic probability theory.
Contents
Introduction
Statistical science is concerned with the planning of studies, especially with the design of randomized experiments and with the planning of surveys using random sampling. The initial analysis of the data from properly randomized studies often follows the study protocol.
Of course, the data from a randomized study can be analyzed to consider secondary hypotheses or to suggest new ideas. A secondary analysis of the data from a planned study uses tools from data analysis.
Data analysis is divided into:
While the tools of data analysis work best on data from randomized studies, they are also applied to other kinds of data --- for example, from natural experiments and observational studies, in which case the inference is dependent on the model chosen by the statistician, and so subjective.
Mathematical statistics has been inspired by and has extended many options in applied statistics.
Topics
The following are some of the important topics in mathematical statistics:
Probability distributions
A probability distribution assigns a probability to each measurable subset of the possible outcomes of a random experiment, survey, or procedure of statistical inference. Examples are found in experiments whose sample space is non-numerical, where the distribution would be a categorical distribution; experiments whose sample space is encoded by discrete random variables, where the distribution can be specified by a probability mass function; and experiments with sample spaces encoded by continuous random variables, where the distribution can be specified by a probability density function. More complex experiments, such as those involving stochastic processes defined in continuous time, may demand the use of more general probability measures.
A probability distribution can either be univariate or multivariate. A univariate distribution gives the probabilities of a single random variable taking on various alternative values; a multivariate distribution (a joint probability distribution) gives the probabilities of a random vector—a set of two or more random variables—taking on various combinations of values. Important and commonly encountered univariate probability distributions include the binomial distribution, the hypergeometric distribution, and the normal distribution. The multivariate normal distribution is a commonly encountered multivariate distribution.
Special distributions
Statistical inferences
Statistical inference is the process of drawing conclusions from data that are subject to random variation, for example, observational errors or sampling variation. Initial requirements of such a system of procedures for inference and induction are that the system should produce reasonable answers when applied to well-defined situations and that it should be general enough to be applied across a range of situations. Inferential statistics are used to test hypotheses and make estimations using sample data. Whereas descriptive statistics describe a sample, inferential statistics infer predictions about a larger population that the sample represents.
The outcome of statistical inference may be an answer to the question "what should be done next?", where this might be a decision about making further experiments or surveys, or about drawing a conclusion before implementing some organizational or governmental policy. For the most part, statistical inference makes propositions about populations, using data drawn from the population of interest via some form of random sampling. More generally, data about a random process is obtained from its observed behavior during a finite period of time. Given a parameter or hypothesis about which one wishes to make inference, statistical inference most often uses:
Regression
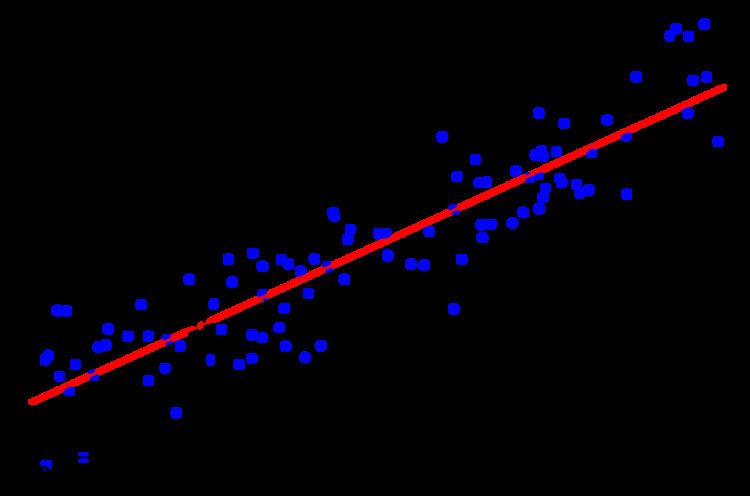
In statistics, regression analysis is a statistical process for estimating the relationships among variables. It includes many techniques for modeling and analyzing several variables, when the focus is on the relationship between a dependent variable and one or more independent variables. More specifically, regression analysis helps one understand how the typical value of the dependent variable (or 'criterion variable') changes when any one of the independent variables is varied, while the other independent variables are held fixed. Most commonly, regression analysis estimates the conditional expectation of the dependent variable given the independent variables – that is, the average value of the dependent variable when the independent variables are fixed. Less commonly, the focus is on a quantile, or other location parameter of the conditional distribution of the dependent variable given the independent variables. In all cases, the estimation target is a function of the independent variables called the regression function. In regression analysis, it is also of interest to characterize the variation of the dependent variable around the regression function which can be described by a probability distribution.
Many techniques for carrying out regression analysis have been developed. Familiar methods such as linear regression and ordinary least squares regression are parametric, in that the regression function is defined in terms of a finite number of unknown parameters that are estimated from the data. Nonparametric regression refers to techniques that allow the regression function to lie in a specified set of functions, which may be infinite-dimensional.
Nonparametric statistics
Nonparametric statistics are statistics not based on parameterized families of probability distributions. They include both descriptive and inferential statistics. The typical parameters are the mean, variance, etc. Unlike parametric statistics, nonparametric statistics make no assumptions about the probability distributions of the variables being assessed.
Non-parametric methods are widely used for studying populations that take on a ranked order (such as movie reviews receiving one to four stars). The use of non-parametric methods may be necessary when data have a ranking but no clear numerical interpretation, such as when assessing preferences. In terms of levels of measurement, non-parametric methods result in "ordinal" data.
As non-parametric methods make fewer assumptions, their applicability is much wider than the corresponding parametric methods. In particular, they may be applied in situations where less is known about the application in question. Also, due to the reliance on fewer assumptions, non-parametric methods are more robust.
Another justification for the use of non-parametric methods is simplicity. In certain cases, even when the use of parametric methods is justified, non-parametric methods may be easier to use. Due both to this simplicity and to their greater robustness, non-parametric methods are seen by some statisticians as leaving less room for improper use and misunderstanding.
Statistics, mathematics, and mathematical statistics
Mathematical statistics has substantial overlap with the discipline of statistics. Statistical theorists study and improve statistical procedures with mathematics, and statistical research often raises mathematical questions. Statistical theory relies on probability and decision theory.
Mathematicians and statisticians like Gauss, Laplace, and C. S. Peirce used decision theory with probability distributions and loss functions (or utility functions). The decision-theoretic approach to statistical inference was reinvigorated by Abraham Wald and his successors, and makes extensive use of scientific computing, analysis, and optimization; for the design of experiments, statisticians use algebra and combinatorics.