
 | ||
A hardiness zone is a geographically defined area in which a specific category of plant life is capable of growing, as defined by climatic conditions, including its ability to withstand the minimum temperatures of the zone (see the scale on the right or the table below). For example, a plant that is described as "hardy to zone 10" means that the plant can withstand a minimum temperature of −1 °C (30 °F). A more resilient plant that is "hardy to zone 9" can tolerate a minimum temperature of −7 °C (19 °F). First developed by the United States Department of Agriculture (USDA), the use of the zones has been adopted by other countries.
Contents
Benefits and drawbacks
The hardiness zones are informative: the extremes of winter cold are a major determinant of whether a plant species can be cultivated outdoors at a particular location; however, the USDA hardiness zones have a number of drawbacks if used without supplementary information. The zones do not incorporate summer heat levels into the zone determination; thus sites which may have the same mean winter minima, but markedly different summer temperatures, will be accorded the same hardiness zone.
Another issue is that the hardiness zones do not take into account the reliability of the snow cover. Snow acts as an insulator against extreme cold, protecting the root system of hibernating plants. If the snow cover is reliable, the actual temperature to which the roots are exposed will not be as low as the hardiness zone number would indicate. As an example, Quebec City in Canada is located in zone 4, but can rely on a significant snow cover every year, making it possible to cultivate plants normally rated for zones 5 or 6. But, in Montreal, located to the southwest in zone 5, it is sometimes difficult to cultivate plants adapted to the zone because of the unreliable snow cover.
Other factors that affect plant survival, though not considered in hardiness zones, are soil moisture, humidity, the number of days of frost, and the risk of a rare catastrophic cold snap. Some risk evaluation – the probability of getting a particularly severe low temperature – often would be more useful than just the average conditions.
Lastly, many plants may survive in a locality but will not flower if the day length is insufficient or if they require vernalization (a particular duration of low temperature). With annuals, the time of planting can often be adjusted to allow growth beyond their normal geographical range.
An alternative means of describing plant hardiness is to use "indicator plants" (the USDA also publishes a list of these to go with the hardiness zone map). In this method, common plants with known limits to their range are used.
Gardening books are available that provide more information on climate zones. For example, Sunset Books (associated with Sunset magazine) publishes a series that breaks up climate zones more finely than the USDA zones. They identify 45 distinct zones in the US, incorporating ranges of temperatures in all seasons, precipitation, wind patterns, elevation, and length and structure of the growing season.
Ireland and UK
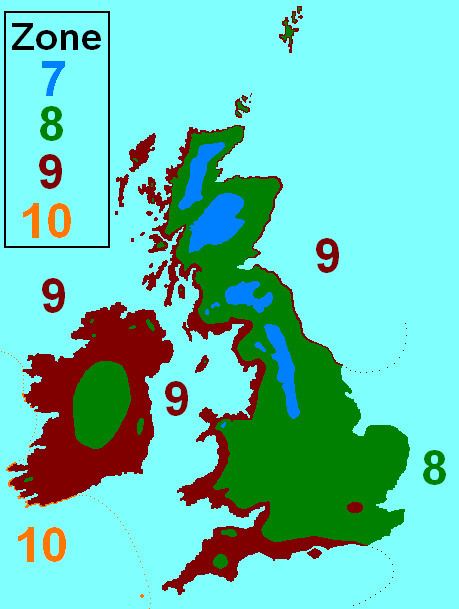
Owing to the moderating effect of the North Atlantic Current on the Irish and British temperate maritime climate, Britain, and Ireland even more so, have milder winters than their northerly position would otherwise afford. This means that the hardiness zones relevant to Britain and Ireland are quite high, from 7 to 10, as shown below.
In 2012 the United Kingdom's Royal Horticultural Society introduced new hardiness ratings for plants, from H7, the hardiest (tolerant of temperatures below -20°C) to H1a (needing temperatures above 15°C).
Northern Europe
Scandinavia lies at the same latitude as Alaska or Greenland, but the effect of the warm North Atlantic Current is even more pronounced here than it is in Britain and Ireland. Save for a very small spot near Karasjok, Norway, which is in zone 2, nowhere in the Arctic part of Scandinavia does it get below zone 3. The Faroe Islands, at 62–63°N are in zone 8, as are the outer Lofoten Islands at 68°N. Tromsø, a coastal city in Norway at 70°N, is in zone 7, and even Longyearbyen, the northernmost true city in the world at 78°N, is still in zone 5. All these coastal locations have one thing in common, though, which are cold, damp summers, with temperatures rarely exceeding 20 °C (68 °F), or 15 °C (59 °F) in Longyearbyen. This shows the importance of taking heat zones into account for better understanding of what may or may not grow.
In Sweden and Finland generally, at sea level to 500 metres (1,600 ft), zone 3 is north of the Arctic Circle, including cities like Karesuando, Pajala and Rovaniemi. Kiruna is the major exception here, which being located on a hill above frost traps, is in zone 5. Zone 4 lies between the Arctic Circle and about 64–65°N, with cities such as Oulu and Jokkmokk, zone 5 (south to 61–62°N) contains cities such as Tampere, Umeå and Östersund. Zone 6 covers the south of mainland Finland, Sweden north of 60°N, and the high plateau of Småland further south. Here one will find cities such as Gävle, Örebro, Sundsvall and Helsinki. The Åland Islands, as well as coastal Southern Sweden, and the Stockholm area are in zone 7. The west coast of Sweden (Gothenburg and southwards) enjoys particularly mild winters and lies in zone 7, therefore being friendly to some hardy exotic species (found, for example, in the Gothenburg Botanical Garden), the southeast coast of Sweden has a colder winter due to the absence of the Gulf Stream.
Central Europe
Central Europe is a good example of a transition from an oceanic climate to a continental climate, which can be noticed immediately when looking at the hardiness zones, which tend to decrease mainly eastwards instead of northwards. Also, the plateaux and low mountain ranges in this region have a significant impact on how cold it might get during winter. Generally speaking, the hardiness zones are high considering the latitude of the region, although not as high as in the Shetland Islands where zone 9 extends to over 60°N. In Central Europe, the relevant zones decrease from zone 8 on the Belgian, Dutch and German North Sea coast, with the exception of some of the Frisian Islands (notably Vlieland and Terschelling), the island of Heligoland and some of the islands in the Rhine-Scheldt estuary, which are in zone 9, to zone 5 around Suwałki, Podlachia on the far eastern border between Poland and Lithuania. Some isolated, high elevation areas of the Alps and Carpathians may even go down to zone 3 or 4. An extreme example of a cold sink is Funtensee, Bavaria which is at least in zone 3 and maybe even in zone 1 or 2. Another notable example is Waksmund, a small village in the Polish Carpathians, which regularly reaches −35 °C (−31 °F) during winter on calm nights when cold and heavy airmasses from the surrounding Gorce and Tatra Mountains descend down the slopes to this low-lying valley, creating extremes which can be up to 10 °C (18 °F) colder than nearby Nowy Targ or Białka Tatrzańska, which are both higher up in elevation. Waksmund is in zone 3b while nearby Kraków, only 80 km (50 mi) to the north and 300 m (980 ft) lower is in zone 6a. These examples prove that local topography can have a pronounced effect on temperature and thus on what is possible to grow in a specific region.
Southern Europe
The southern European marker plant for climate as well as cultural indicator is the olive tree, which cannot long periods below zero so its cultivation area matches the cool winter zone. The Mediterranean Sea acts as a temperature regulator, so this area is generally warmer than other parts of the continent; except in mountainous areas where the sea effect lowers, it belongs in zones 8–10; however, southern Balkans (mountainous- Western and Eastern Serbia, continental Croatia and Bulgaria) are colder in winter and are in zones 6–7. The Croatian (Dalmatian) coast, Albania and northern Greece are in zones 8–9, as are central-northern Italy (hills and some spots in Po Valley are however colder) and southern France; Central Iberia is 8–9 (some areas are slightly colder). The Spanish and Portuguese Atlantic coast, most of Andalusia and Murcia, almost all the Valencian Community, a part of Catalonia, Balearic Islands, southwestern Sardinia, most of Sicily, coastal southern Italy and southwestern Greece are in zone 10, the islands of Malta, Lampedusa and the southern zone of Spain (Málaga, Cádiz and Granada, where there is mango and avocado cultivation) belong to zone 11a. Also, a few areas on the southernmost coast of Cyprus are inside zone 11a.
European cities
The table below provides hardiness zone data for some European cities (based on climatological data):
United States hardiness zones
Most of the warmer zones (zones 8, 9, 10, and 11) are located in the southern half of the United States. The low latitude and often stable weather in the far southwestern states, California, and Florida is responsible for the few episodes of severe cold relative to normal in those areas. The more northerly and central portions of the USA are the cooler zones (zones 7, 6, 5, and 4). The central and northerly portions of the mainland often have much less consistent range of temperatures in winter due to being more continental, and thus the zone map has its limitations in these areas.
The USDA first issued its standardized hardiness zone map in 1960, and revised it in 1965. The newest maps were issued in 2012 by the USD, and show a warming of most zones across the USA.
Updates
In 2003, the American Horticultural Society (AHS) produced a draft revised map, using temperature data collected from July 1986 to March 2002. The 2003 map placed many areas approximately a half-zone higher (warmer) than the 1990 map had. Reviewers noted the map zones appeared to be closer to the original 1960 map in its overall zone delineations. The 2003 AHS draft map purported to show finer detail, for example, reflecting urban heat islands by showing the downtown areas of several cities (e.g., Baltimore, Maryland; Washington, D.C. and Atlantic City, New Jersey) as a full zone warmer than outlying areas. The map excluded the detailed a/b half-zones introduced in the 1990 map, an omission widely criticized by horticulturists and gardeners due to the coarseness of the resulting map. The USDA rejected the AHS 2003 draft map; the agency stated it would create its own map in an interactive computer format. As of August 2010 the AHS and the National Arboretum websites still presented the 1990 map as current.
In 2006, the US National Arbor Day Foundation completed an extensive update of U.S. hardiness zones. It used essentially the same data as the AHS. Once the Foundation analyzed the new data, it revised hardiness zones, reflecting the generally warmer recent temperatures in many parts of the country. The Foundation's 2006 map appears to validate the data used in the AHS 2003 draft. The Foundation also did away with the more detailed a/b half-zone delineations.
In 2012 the USDA updated their plant hardiness map to reflect the warmer observed temperatures in the past thirty years.
U.S. cities
The USDA plant hardiness zones for U.S. cities as based on the 2012 map are the following:
Australian hardiness zones
The USDA hardiness zones are in use in Australia, but in addition the Australian National Botanic Gardens have devised another system more in keeping with Australian conditions. They are numerically about 7 lower than the USDA system. For example, Australian zone 3 is roughly equivalent to USDA zone 9. The higher Australian zone numbers have no US equivalents.
There are problems with classifications of this type: the spread of weather stations is insufficient to give clear zones and too many places with different climates are lumped together. Only 738 Australian stations have records of more than ten years (one station per 98,491 hectares or 243,380 acres), though more populated areas have relatively fewer hectares per station. Local factors such as aspect, altitude, proximity to the sea also complicate the matter. For example, Mount Isa has three climatic stations with more than a ten-year record. One is in zone 4a, one in zone 4b and the other is in zone 5a. Likewise, Sydney residents can choose between zones 3a and 4b. Most other cities have similar problems. Different locations in the same city are suitable for different plants, making it hard to draw a meaningful map. There may even be a case for publishing a list of weather stations and their zone classification to allow best use of local conditions.
Canadian hardiness zones
Climate variables that reflect the capacity and detriments to plant growth are used to develop an index that is mapped to Canada's Plant Hardiness Zones. This index comes from a formula originally developed by Ouellet and Sherk. Their formula is:
Y = -67.62 + 1.734X₁ + 0.1868X₂ + 69.77X₃ + 1.256X₄ + 0.006119X₅ + 22.37X₆ - 0.01832X₇
where: Y = estimated index of suitability X₁ = monthly mean of the daily minimum temperatures (°C) of the coldest month X₂ = mean frost free period above 0 °C in days X₃ = amount of rainfall (R) from June to November, inclusive, in terms of R/(R+a) where a=25.4 if R is in millimeters and a=1 if R is in inches X₄ = monthly mean of the daily maximum temperatures (°C) of the warmest month X₅ = winter factor expressed in terms of (0 °C - X₁)Rjan where Rjan represents the rainfall in January expressed in mm X₆ = mean maximum snow depth in terms of S/(S+a) where a=25.4 if S is in millimeters and a=1 if S is in inches X₇ = maximum wind gust in (km/hr) in 30 years
For practical purposes, Canada has adopted the American hardiness zone classification system.
American Horticultural Society heat zones
In addition to the USDA Hardiness zones there are the American Horticultural Society (AHS) heat zones.
The criterion is the average number of days per year when the temperature exceeds 30 °C (86 °F). The AHS Heat Zone Map for the US is available on the American Horticultural Society website.
South Africa
South Africa has five horticultural or climatic zones.