
 | ||
A DNA microarray (also commonly known as DNA chip or biochip) is a collection of microscopic DNA spots attached to a solid surface. Scientists use DNA microarrays to measure the expression levels of large numbers of genes simultaneously or to genotype multiple regions of a genome. Each DNA spot contains picomoles (10−12 moles) of a specific DNA sequence, known as probes (or reporters or oligos). These can be a short section of a gene or other DNA element that are used to hybridize a cDNA or cRNA (also called anti-sense RNA) sample (called target) under high-stringency conditions. Probe-target hybridization is usually detected and quantified by detection of fluorophore-, silver-, or chemiluminescence-labeled targets to determine relative abundance of nucleic acid sequences in the target. The original nucleic acid arrays were macro arrays approximately 9 cm × 12 cm and the first computerized image based analysis was published in 1981.
Contents
Principle
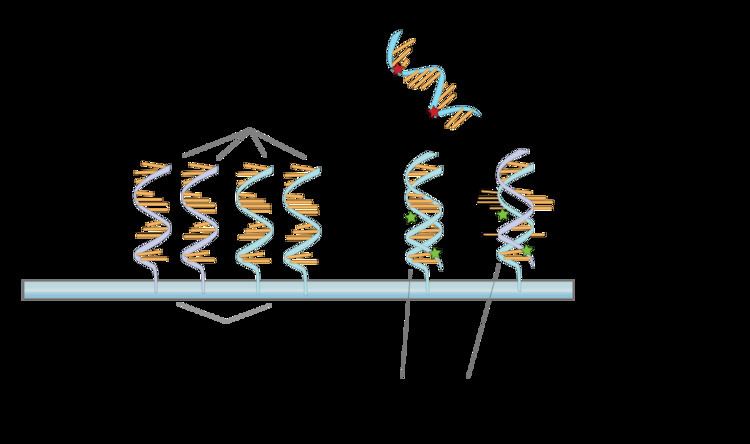
The core principle behind microarrays is hybridization between two DNA strands, the property of complementary nucleic acid sequences to specifically pair with each other by forming hydrogen bonds between complementary nucleotide base pairs. A high number of complementary base pairs in a nucleotide sequence means tighter non-covalent bonding between the two strands. After washing off non-specific bonding sequences, only strongly paired strands will remain hybridized. Fluorescently labeled target sequences that bind to a probe sequence generate a signal that depends on the hybridization conditions (such as temperature), and washing after hybridization. Total strength of the signal, from a spot (feature), depends upon the amount of target sample binding to the probes present on that spot. Microarrays use relative quantitation in which the intensity of a feature is compared to the intensity of the same feature under a different condition, and the identity of the feature is known by its position.
Uses and types
Many types of arrays exist and the broadest distinction is whether they are spatially arranged on a surface or on coded beads:
DNA microarrays can be used to detect DNA (as in comparative genomic hybridization), or detect RNA (most commonly as cDNA after reverse transcription) that may or may not be translated into proteins. The process of measuring gene expression via cDNA is called expression analysis or expression profiling.
Applications include:
Fabrication
Microarrays can be manufactured in different ways, depending on the number of probes under examination, costs, customization requirements, and the type of scientific question being asked. Arrays may have as few as 10 probes or up to 2.1 million micrometre-scale probes from commercial vendors.
Spotted vs. in situ synthesised arrays
Microarrays can be fabricated using a variety of technologies, including printing with fine-pointed pins onto glass slides, photolithography using pre-made masks, photolithography using dynamic micromirror devices, ink-jet printing, or electrochemistry on microelectrode arrays.
In spotted microarrays, the probes are oligonucleotides, cDNA or small fragments of PCR products that correspond to mRNAs. The probes are synthesized prior to deposition on the array surface and are then "spotted" onto glass. A common approach utilizes an array of fine pins or needles controlled by a robotic arm that is dipped into wells containing DNA probes and then depositing each probe at designated locations on the array surface. The resulting "grid" of probes represents the nucleic acid profiles of the prepared probes and is ready to receive complementary cDNA or cRNA "targets" derived from experimental or clinical samples. This technique is used by research scientists around the world to produce "in-house" printed microarrays from their own labs. These arrays may be easily customized for each experiment, because researchers can choose the probes and printing locations on the arrays, synthesize the probes in their own lab (or collaborating facility), and spot the arrays. They can then generate their own labeled samples for hybridization, hybridize the samples to the array, and finally scan the arrays with their own equipment. This provides a relatively low-cost microarray that may be customized for each study, and avoids the costs of purchasing often more expensive commercial arrays that may represent vast numbers of genes that are not of interest to the investigator. Publications exist which indicate in-house spotted microarrays may not provide the same level of sensitivity compared to commercial oligonucleotide arrays, possibly owing to the small batch sizes and reduced printing efficiencies when compared to industrial manufactures of oligo arrays.
In oligonucleotide microarrays, the probes are short sequences designed to match parts of the sequence of known or predicted open reading frames. Although oligonucleotide probes are often used in "spotted" microarrays, the term "oligonucleotide array" most often refers to a specific technique of manufacturing. Oligonucleotide arrays are produced by printing short oligonucleotide sequences designed to represent a single gene or family of gene splice-variants by synthesizing this sequence directly onto the array surface instead of depositing intact sequences. Sequences may be longer (60-mer probes such as the Agilent design) or shorter (25-mer probes produced by Affymetrix) depending on the desired purpose; longer probes are more specific to individual target genes, shorter probes may be spotted in higher density across the array and are cheaper to manufacture. One technique used to produce oligonucleotide arrays include photolithographic synthesis (Affymetrix) on a silica substrate where light and light-sensitive masking agents are used to "build" a sequence one nucleotide at a time across the entire array. Each applicable probe is selectively "unmasked" prior to bathing the array in a solution of a single nucleotide, then a masking reaction takes place and the next set of probes are unmasked in preparation for a different nucleotide exposure. After many repetitions, the sequences of every probe become fully constructed. More recently, Maskless Array Synthesis from NimbleGen Systems has combined flexibility with large numbers of probes.
Two-channel vs. one-channel detection
Two-color microarrays or two-channel microarrays are typically hybridized with cDNA prepared from two samples to be compared (e.g. diseased tissue versus healthy tissue) and that are labeled with two different fluorophores. Fluorescent dyes commonly used for cDNA labeling include Cy3, which has a fluorescence emission wavelength of 570 nm (corresponding to the green part of the light spectrum), and Cy5 with a fluorescence emission wavelength of 670 nm (corresponding to the red part of the light spectrum). The two Cy-labeled cDNA samples are mixed and hybridized to a single microarray that is then scanned in a microarray scanner to visualize fluorescence of the two fluorophores after excitation with a laser beam of a defined wavelength. Relative intensities of each fluorophore may then be used in ratio-based analysis to identify up-regulated and down-regulated genes.
Oligonucleotide microarrays often carry control probes designed to hybridize with RNA spike-ins. The degree of hybridization between the spike-ins and the control probes is used to normalize the hybridization measurements for the target probes. Although absolute levels of gene expression may be determined in the two-color array in rare instances, the relative differences in expression among different spots within a sample and between samples is the preferred method of data analysis for the two-color system. Examples of providers for such microarrays includes Agilent with their Dual-Mode platform, Eppendorf with their DualChip platform for colorimetric Silverquant labeling, and TeleChem International with Arrayit.
In single-channel microarrays or one-color microarrays, the arrays provide intensity data for each probe or probe set indicating a relative level of hybridization with the labeled target. However, they do not truly indicate abundance levels of a gene but rather relative abundance when compared to other samples or conditions when processed in the same experiment. Each RNA molecule encounters protocol and batch-specific bias during amplification, labeling, and hybridization phases of the experiment making comparisons between genes for the same microarray uninformative. The comparison of two conditions for the same gene requires two separate single-dye hybridizations. Several popular single-channel systems are the Affymetrix "Gene Chip", Illumina "Bead Chip", Agilent single-channel arrays, the Applied Microarrays "CodeLink" arrays, and the Eppendorf "DualChip & Silverquant". One strength of the single-dye system lies in the fact that an aberrant sample cannot affect the raw data derived from other samples, because each array chip is exposed to only one sample (as opposed to a two-color system in which a single low-quality sample may drastically impinge on overall data precision even if the other sample was of high quality). Another benefit is that data are more easily compared to arrays from different experiments as long as batch effects have been accounted for.
One channel microarray may be the only choice in some situations. Suppose
A typical protocol
This is an example of a DNA microarray experiment, detailing a particular case to better explain DNA microarray experiments, while enumerating possible alternatives.
- The two samples to be compared (pairwise comparison) are grown/acquired. In this example treated sample (case) and untreated sample (control).
- The nucleic acid of interest is purified: this can be all RNA for expression profiling, DNA for comparative hybridization, or DNA/RNA bound to a particular protein which is immunoprecipitated (ChIP-on-chip) for epigenetic or regulation studies. In this example total RNA is isolated (total as it is nuclear and cytoplasmic) by Guanidinium thiocyanate-phenol-chloroform extraction (e.g. Trizol) which isolates most RNA (whereas column methods have a cut off of 200 nucleotides) and if done correctly has a better purity.
- The purified RNA is analysed for quality (by capillary electrophoresis) and quantity (for example, by using a NanoDrop or NanoPhotometer spectrometer). If the material is of acceptable quality and sufficient quantity is present (e.g., >1μg, although the required amount varies by microarray platform), the experiment can proceed.
- The labelled product is generated via reverse transcription and sometimes with an optional PCR amplification. The RNA is reverse transcribed with either polyT primers (which amplify only mRNA) or random primers (which amplify all RNA, most of which is rRNA); miRNA microarrays ligate an oligonucleotide to the purified small RNA (isolated with a fractionator), which is then reverse transcribed and amplified. The label is added either during the reverse transcription step, or following amplification if it is performed. The sense labelling is dependent on the microarray; e.g. if the label is added with the RT mix, the cDNA is antisense and the microarray probe is sense, except in the case of negative controls. The label is typically fluorescent; only one machine uses radiolabels. The labelling can be direct (not used) or indirect (requires a coupling stage). For two-channel arrays, the coupling stage occurs before hybridization, using aminoallyl uridine triphosphate (aminoallyl-UTP, or aaUTP) and NHS amino-reactive dyes (such as cyanine dyes); for single-channel arrays, the coupling stage occurs after hybridization, using biotin and labelled streptavin. The modified nucleotides (usually in a ratio of 1 aaUTP: 4 TTP (thymidine triphosphate)) are added enzymatically in a low ratio to normal nucleotides, typically resulting in 1 every 60 bases. The aaDNA is then purified with a column (using a phosphate buffer solution, as Tris contains amine groups). The aminoallyl group is an amine group on a long linker attached to the nucleobase, which reacts with a reactive dye. A form of replicate known as a dye flipcan be performed to remove any dye effects in two-channel experiments; for a dye flip, a second slide is used, with the labels swapped (the sample that was labeled with Cy3 in the first slide is labeled with Cy5, and vice versa). In this example, aminoallyl-UTP is present in the reverse-transcribed mixture.
- The labeled samples are then mixed with a propriety hybridization solution which can consist of SDS, SSC, dextran sulfate, a blocking agent (such as COT1 DNA, salmon sperm DNA, calf thymus DNA, PolyA or PolyT), Denhardt's solution, or formamine.
- The mixture is denatured and added to the pinholes of the microarray. The holes are sealed and the microarray hybridized, either in a hyb oven, where the microarray is mixed by rotation, or in a mixer, where the microarray is mixed by alternating pressure at the pinholes.
- After an overnight hybridization, all nonspecific binding is washed off (SDS and SSC).
- The microarray is dried and scanned by a machine that uses a laser to excite the dye and measures the emission levels with a detector.
- The image is gridded with a template and the intensities of each feature (composed of several pixels) is quantified.
- The raw data is normalized; the simplest normalization method is to subtract background intensity and scale so that the total intensities of the features of the two channels are equal, or to use the intensity of a reference gene to calculate the t-value for all of the intensities. More sophisticated methods include z-ratio, loess and lowess regression and RMA (robust multichip analysis) for Affymetrix chips (single-channel, silicon chip, in situ synthesised short oligonucleotides).
Microarrays and bioinformatics
The advent of inexpensive microarray experiments created several specific bioinformatics challenges:
Experimental design
Due to the biological complexity of gene expression, the considerations of experimental design that are discussed in the expression profiling article are of critical importance if statistically and biologically valid conclusions are to be drawn from the data.
There are three main elements to consider when designing a microarray experiment. First, replication of the biological samples is essential for drawing conclusions from the experiment. Second, technical replicates (two RNA samples obtained from each experimental unit) help to ensure precision and allow for testing differences within treatment groups. The biological replicates include independent RNA extractions and technical replicates may be two aliquots of the same extraction. Third, spots of each cDNA clone or oligonucleotide are present as replicates (at least duplicates) on the microarray slide, to provide a measure of technical precision in each hybridization. It is critical that information about the sample preparation and handling is discussed, in order to help identify the independent units in the experiment and to avoid inflated estimates of statistical significance.
Standardization
Microarray data is difficult to exchange due to the lack of standardization in platform fabrication, assay protocols, and analysis methods. This presents an interoperability problem in bioinformatics. Various grass-roots open-source projects are trying to ease the exchange and analysis of data produced with non-proprietary chips:
Data analysis
Microarray data sets are commonly very large, and analytical precision is influenced by a number of variables. Statistical challenges include taking into account effects of background noise and appropriate normalization of the data. Normalization methods may be suited to specific platforms and, in the case of commercial platforms, the analysis may be proprietary. Algorithms that affect statistical analysis include:
Microarray data may require further processing aimed at reducing the dimensionality of the data to aid comprehension and more focused analysis. Other methods permit analysis of data consisting of a low number of biological or technical replicates; for example, the Local Pooled Error (LPE) test pools standard deviations of genes with similar expression levels in an effort to compensate for insufficient replication.
Annotation
The relation between a probe and the mRNA that it is expected to detect is not trivial. Some mRNAs may cross-hybridize probes in the array that are supposed to detect another mRNA. In addition, mRNAs may experience amplification bias that is sequence or molecule-specific. Thirdly, probes that are designed to detect the mRNA of a particular gene may be relying on genomic EST information that is incorrectly associated with that gene.
Data warehousing
Microarray data was found to be more useful when compared to other similar datasets. The sheer volume of data, specialized formats (such as MIAME), and curation efforts associated with the datasets require specialized databases to store the data. A number of open-source data warehousing solutions, such as InterMine and BioMart, have been created for the specific purpose of integrating diverse biological datasets, and also support analysis.
Alternative technologies
Advances in massively parallel sequencing has led to the development of RNA-Seq technology, that enables a whole transcriptome shotgun approach to characterize and quantify gene expression. Unlike microarrays, which need a reference genome and transcriptome to be available before the microarray itself can be designed, RNA-Seq can also be used for new model organisms whose genome has not been sequenced yet.