
 | ||
RNA-Seq (RNA sequencing), also called whole transcriptome shotgun sequencing (WTSS), uses next-generation sequencing (NGS) to reveal the presence and quantity of RNA in a biological sample at a given moment in time.
Contents
- Library preparation
- Small RNAnon coding RNA sequencing
- Direct RNA sequencing
- Experimental considerations
- Transcriptome assembly
- Gene expression
- Differential expression and absolute quantification of transcripts
- Coexpression networks
- Single nucleotide variation discovery
- Post transcriptional SNVs
- Fusion gene detection
- History
- ENCODE and TCGA
- References
RNA-Seq is used to analyze the continually changing cellular transcriptome. Specifically, RNA-Seq facilitates the ability to look at alternative gene spliced transcripts, post-transcriptional modifications, gene fusion, mutations/SNPs and changes in gene expression over time, or differences in gene expression in different groups or treatments. In addition to mRNA transcripts, RNA-Seq can look at different populations of RNA to include total RNA, small RNA, such as miRNA, tRNA, and ribosomal profiling. RNA-Seq can also be used to determine exon/intron boundaries and verify or amend previously annotated 5' and 3' gene boundaries.
Prior to RNA-Seq, gene expression studies were done with hybridization-based microarrays. Issues with microarrays include cross-hybridization artifacts, poor quantification of lowly and highly expressed genes, and needing to know the sequence a priori. Because of these technical issues, transcriptomics transitioned to sequencing-based methods. These progressed from Sanger sequencing of Expressed Sequence Tag libraries, to chemical tag-based methods (e.g., serial analysis of gene expression), and finally to the current technology, next-gen sequencing of cDNA (notably RNA-Seq).
Library preparation
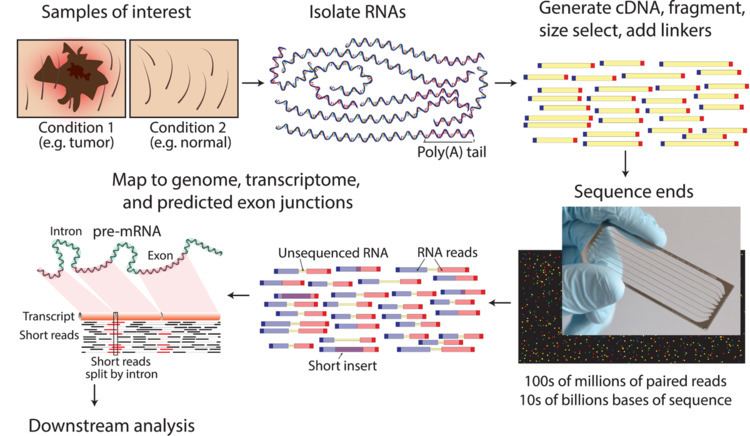
The general steps to prepare a complementary DNA (cDNA) library for sequencing are described below, but often vary between platforms.
- RNA Isolation: RNA is isolated from tissue and mixed with deoxyribonuclease (DNase). DNase reduces the amount of genomic DNA. The amount of RNA degradation is checked with gel and capillary electrophoresis and is used to assign an RNA integrity number to the sample. This RNA quality and the total amount of starting RNA are taken into consideration during the subsequent library preparation, sequencing, and analysis steps.
- RNA selection/depletion: To analyze signals of interest, the isolated RNA can either be kept as is, filtered for RNA with 3' polyadenylated (poly(A)) tails to include only mRNA, depleted of ribosomal RNA (rRNA), and/or filtered for RNA that binds specific sequences (Table). The RNA with 3' poly(A) tails are mature, processed, coding sequences. Poly(A) selection is performed by mixing RNA with poly(T) oligomers covalently attached to a substrate, typically magnetic beads. Poly(A) selection ignores noncoding RNA and introduces 3' bias, which is avoided with the ribosomal depletion strategy. The rRNA is removed because it represents over 90% of the RNA in a cell, which if kept would drown out other data in the transcriptome.
- cDNA synthesis: DNA sequencing technology is more mature, so the RNA is reverse transcribed to cDNA. Reverse transcription results in loss of strandedness, which can be avoided with chemical labelling. Fragmentation and size selection are performed to purify sequences that are the appropriate length for the sequencing machine. The RNA, cDNA, or both are fragmented with enzymes, sonication, or nebulizers. Fragmentation of the RNA reduces 5' bias of randomly primed-reverse transcription and the influence of primer binding sites, with the downside that the 5' and 3' ends are converted to DNA less efficiently. Fragmentation is followed by size selection, where either small sequences are removed or a tight range of sequence lengths are selected. Because small RNAs like miRNAs are lost, these are analyzed independently. The cDNA for each experiment can be indexed with a hexamer or octamer barcode, so that these experiments can be pooled into a single lane for multiplexed sequencing.
Small RNA/non-coding RNA sequencing
When sequencing RNA other than mRNA, the library preparation is modified. The cellular RNA is selected based on the desired size range. For small RNA targets, such as miRNA, the RNA is isolated through size selection. This can be performed with a size exclusion gel, through size selection magnetic beads, or with a commercially developed kit. Once isolated, linkers are added to the 3' and 5' end then purified. The final step is cDNA generation through reverse transcription.
Direct RNA sequencing
As converting RNA into cDNA using reverse transcriptase has been shown to introduce biases and artifacts that may interfere with both the proper characterization and quantification of transcripts, single molecule Direct RNA Sequencing (DRSTM) technology was under development by Helicos (now bankrupt). DRSTM sequences RNA molecules directly in a massively-parallel manner without RNA conversion to cDNA or other biasing sample manipulations such as ligation and amplification.
Experimental considerations
A variety of parameters are considered when designing and conducting RNA-Seq experiments:
Transcriptome assembly
Two methods are used to assign raw sequence reads to genomic features (i.e., assemble the transcriptome):
A note on assembly quality: The current consensus is that 1) assembly quality can vary depending on which metric is used, 2) assemblies that scored well in one species do not necessarily perform well in the other species, and 3) combining different approaches might be the most reliable.
Gene expression
Expression is quantified to study cellular changes in response to external stimuli, differences between healthy and diseased states, and other research questions. Gene expression is often used as a proxy for protein abundance, but these are often not equivalent due to post transcriptional events such as RNA interference and nonsense-mediated decay.
Expression is quantified by counting the number of reads that mapped to each locus in the transcriptome assembly step. Expression can be quantified for exons or genes using contigs or reference transcript annotations. These observed RNA-Seq read counts have been robustly validated against older technologies, including expression microarrays and qPCR. Tools that quantify counts are HTSeq, FeatureCounts, Rcount, maxcounts, FIXSEQ, and Cuffquant. The read counts are then converted into appropriate metrics for hypothesis testing, regressions, and other analyses. Parameters for this conversion are:
Differential expression and absolute quantification of transcripts
RNA-Seq is generally used to compare gene expression between conditions, such as a drug treatment vs non-treated, and find out which genes are up- or down-regulated in each condition. In principle, RNA-Seq will make it possible to account for all the transcripts in the cell for each condition. Differently expressed genes can be identified using tools that count the sequencing reads per gene and compare them between samples. Many packages are available for this type of analysis; some of the most commonly used tools are DESeq and edgeR, packages from Bioconductor. Both these tools use a model based on the negative binomial distribution.
It is not possible to do absolute quantification using the common RNA-Seq pipeline, because it only provides RNA levels relative to all transcripts. If the total amount of RNA in the cell changes between conditions, relative normalization will misrepresent the changes for individual transcripts. Absolute quantification of mRNAs is possible by performing RNA-Seq with added spike ins, samples of RNA at known concentrations. After sequencing, the read count of the spike ins sequences is used to determine the direct correspondence between read count and biological fragments. In developmental studies, this technique has been used in Xenopus tropicalis embryos at a high temporal resolution, to determine transcription kinetics.
Coexpression networks
Coexpression networks are data-derived representations of genes behaving in a similar way across tissues and experimental conditions. Their main purpose lies in hypothesis generation and guilt-by-association approaches for inferring functions of previously unknown genes. RNASeq data has been recently used to infer genes involved in specific pathways based on Pearson correlation, both in plants and mammals. The main advantage of RNASeq data in this kind of analysis over the microarray platforms is the capability to cover the entire transcriptome, therefore allowing the possibility to unravel more complete representations of the gene regulatory networks. Differential regulation of the splice isoforms of the same gene can be detected and used to predict and their biological functions. Weighted gene co-expression network analysis has been successfully used to identify co-expression modules and intramodular hub genes based on RNA seq data. Co-expression modules may corresponds to cell types or pathways. Highly connected intramodular hubs can be interpreted as representatives of their respective module. Variance-Stabilizing Transformation approaches for estimating correlation coefficients based on RNA seq data have been proposed.
Single nucleotide variation discovery
Transcriptome single nucleotide variation has been analyzed in maize on the Roche 454 sequencing platform. Directly from the transcriptome analysis, around 7000 single nucleotide polymorphisms (SNPs) were recognized. Following Sanger sequence validation, the researchers were able to conservatively obtain almost 5000 valid SNPs covering more than 2400 maize genes. RNA-seq is limited to transcribed regions however, since it will only discover sequence variations in exon regions. This misses many subtle but important intron alleles that affect disease such as transcription regulators, leaving analysis to only large effectors. While some correlation exists between exon to intron variation, only whole genome sequencing would be able to capture the source of all relevant SNPs.
The only way to be absolutely sure of the individual's mutations is to compare the transcriptome sequences to the germline DNA sequence. This enables the distinction of homozygous genes versus skewed expression of one of the alleles and it can also provide information about genes that were not expressed in the transcriptomic experiment. An R-based statistical package known as CummeRbund can be used to generate expression comparison charts for visual analysis.
Post-transcriptional SNVs
Having the matching genomic and transcriptomic sequences of an individual can also help in detecting post-transcriptional edits, where, if the individual is homozygous for a gene, but the gene's transcript has a different allele, then a post-transcriptional modification event is determined.
mRNA centric single nucleotide variants (SNVs) are generally not considered as a representative source of functional variation in cells, mainly due to the fact that these mutations disappear with the mRNA molecule, however the fact that efficient DNA correction mechanisms do not apply to RNA molecules can cause them to appear more often. This has been proposed as the source of certain prion diseases, also known as TSE or transmissible spongiform encephalopathies.
Fusion gene detection
Caused by different structural modifications in the genome, fusion genes have gained attention because of their relationship with cancer. The ability of RNA-seq to analyze a sample's whole transcriptome in an unbiased fashion makes it an attractive tool to find these kinds of common events in cancer.
The idea follows from the process of aligning the short transcriptomic reads to a reference genome. Most of the short reads will fall within one complete exon, and a smaller but still large set would be expected to map to known exon-exon junctions. The remaining unmapped short reads would then be further analyzed to determine whether they match an exon-exon junction where the exons come from different genes. This would be evidence of a possible fusion event, however, because of the length of the reads, this could prove to be very noisy. An alternative approach is to use pair-end reads, when a potentially large number of paired reads would map each end to a different exon, giving better coverage of these events (see figure). Nonetheless, the end result consists of multiple and potentially novel combinations of genes providing an ideal starting point for further validation.
History
The past five years have seen a flourishing of NGS-based methods for genome analysis leading to the discovery of a number of new mutations and fusion transcripts in cancer. RNA-Seq data could help researchers interpreting the "personalized transcriptome" so that it will help understanding the transcriptomic changes happening therefore, ideally, identifying gene drivers for a disease. The feasibility of this approach is however dictated by the costs in terms of money and time.
A basic search on PubMed reveals that the term RNA Seq, queried as ""RNA Seq" OR "RNA-Seq" OR "RNA sequencing" OR "RNASeq"" in order to capture the most common ways of phrasing it, gives 5.425 hits demonstrating usage statistics of this technology. A few examples will be taken into consideration to explain that RNA-Seq applications to the clinic have the potentials to significantly affect patient's life and, on the other hand, requires a team of specialists (bioinformaticians, physicians/clinicians, basic researchers, technicians) to fully interpret the huge amount of data generated by this analysis.
As an example of clinical applications, researchers at the Mayo Clinic used an RNA-Seq approach to identify differentially expressed transcripts between oral cancer and normal tissue samples. They also accurately evaluated the allelic imbalance (AI), ratio of the transcripts produced by the single alleles, within a subgroup of genes involved in cell differentiation, adhesion, cell motility and muscle contraction identifying a unique transcriptomic and genomic signature in oral cancer patients. Novel insight on skin cancer (melanoma) also come from RNA-Seq of melanoma patients. This approach led to the identification of eleven novel gene fusion transcripts originated from previously unknown chromosomal rearrangements. Twelve novel chimeric transcripts were also reported, including seven of those that confirmed previously identified data in multiple melanoma samples. Furthermore, this approach is not limited to cancer patients. RNA-Seq has been used to study other important chronic diseases such as Alzheimer (AD) and diabetes. In the former case, Twine and colleagues compared the transcriptome of different lobes of deceased AD's patient's brain with the brain of healthy individuals identifying a lower number of splice variants in AD's patients and differential promoter usage of the APOE-001 and -002 isoforms in AD's brains. In the latter case, different groups showed the unicity of the beta-cells transcriptome in diabetic patients in terms of transcripts accumulation and differential promoter usage and long non coding RNAs (lncRNAs) signature.
Compared with microarrays, NGS technology has identified novel and low frequency RNAs associated with disease processes. This advantage aids in the diagnosis and possible future treatments of diseases, including cancer. For example, NGS technology identified several previously undocumented differentially-expressed transcripts in rats treated with AFB1, a potent hepatocarcinogen. Nearly 50 new differentially-expressed transcriptions were identified between the controls and AFB1-treated rats. Additionally potential new exons were identified, including some that are responsive to AFB1. The next-generation sequencing pipeline identified more differential gene expressions compared with microarrays, particularly when DESeq software was utilized. Cufflinks identified two novel transcripts that were not previously annotated in the Ensembl database; these transcripts were confirmed using cloning PCR. Numerous other studies have demonstrated NGS's ability to detect aberrant mRNA and small non-coding RNA expression in disease processes above that provided by microarrays. The lower cost and higher throughput offered by NGS confers another advantage to researchers.
The role of small non-coding RNAs in disease processes has also been explored in recent years. For example, Han et al. (2011) examined microRNA expression differences in bladder cancer patients in order to understand how changes and dysregulation in microRNA can influence mRNA expression and function. Several microRNAs were differentially expressed in the bladder cancer patients. Upregulation in the aberrant microRNAs was more common than downregulation in the cancer patients. One of the upregulated microRNAs, has-miR-96, has been associated with carcinogenesis, and several of the overexpressed microRNAs have also been observed in other cancers, including ovarian and cervical. Some of the downregulated microRNAs in cancer samples were hypothesized to have inhibitory roles.
ENCODE and TCGA
A lot of emphasis has been given to RNA-Seq data after the Encyclopedia of DNA Elements (ENCODE) and The Cancer Genome Atlas (TCGA) projects have used this approach to characterize dozens of cell lines and thousands of primary tumor samples, respectively. ENCODE aimed to identify genome-wide regulatory regions in different cohort of cell lines and transcriptomic data are paramount in order to understand the downstream effect of those epigenetic and genetic regulatory layers. TCGA, instead, aimed to collect and analyze thousands of patient's samples from 30 different tumor types in order to understand the underlying mechanisms of malignant transformation and progression. In this context RNA-Seq data provide a unique snapshot of the transcriptomic status of the disease and look at an unbiased population of transcripts that allows the identification of novel transcripts, fusion transcripts and non-coding RNAs that could be undetected with different technologies.