
 | ||
Phase-contrast X-ray imaging (PCI) or phase-sensitive X-ray imaging is a general term for different technical methods that use information concerning changes in the phase of an X-ray beam that passes through an object in order to create its images. Standard X-ray imaging techniques like radiography or computed tomography (CT) rely on a decrease of the X-ray beam's intensity (attenuation) when traversing the sample, which can be measured directly with the assistance of an X-ray detector. In PCI however, the beam's phase shift caused by the sample is not measured directly, but is transformed into variations in intensity, which then can be recorded by the detector.
Contents
- History
- Physical principle
- Crystal interferometry
- Grating Bonse Hart interferometry
- Analyzer based imaging
- Propagation based imaging
- Grating based imaging
- Edge illumination
- References
In addition to producing projection images, PCI, like conventional transmission, can be combined with tomographic techniques to obtain the 3D distribution of the real part of the refractive index of the sample. When applied to samples that consist of atoms with low atomic number Z, PCI is more sensitive to density variations in the sample than conventional transmission-based X-ray imaging. This leads to images with improved soft tissue contrast.
In the last several years, a variety of phase-contrast X-ray imaging techniques have been developed, all of which are based on the observation of interference patterns between diffracted and undiffracted waves. The most common techniques are crystal interferometry, propagation-based imaging, analyzer-based imaging, edge-illumination and grating-based imaging (see below).
History
The first to discover X-rays was Wilhelm Conrad Röntgen in 1895, which is the reason why they are even today sometimes referred to as "Röntgen rays". He found out that the "new kind of rays" had the ability to penetrate materials opaque for visible light, and he thus recorded the first X-ray image, displaying the hand of his wife. He was awarded the first Nobel Prize in Physics in 1901 "in recognition of the extraordinary services he has rendered by the discovery of the remarkable rays subsequently named after him". Since then, X-rays were used as an invaluable tool to non-destructively determine the inner structure of different objects, although the information was for a long time obtained by measuring the transmitted intensity of the waves only, and the phase information was not accessible.
The principle of phase-contrast imaging in general was developed by Frits Zernike during his work with diffraction gratings and visible light. The application of his knowledge to microscopy won him the Nobel Prize in Physics in 1953. Ever since, phase-contrast microscopy has been an important field of optical microscopy.
The transfer of phase-contrast imaging from visible light to X-rays took a long time due to the slow progress in improving the quality of X-ray beams and the non-availability of X-ray optics (lenses). In the 1970s it was realized that the synchrotron radiation emitted from charged particles circulating in storage rings constructed for high-energy nuclear physics experiments was potentially a much more intense and versatile source of X-rays than X-ray tubes. The construction of synchrotrons and storage rings, explicitly aimed at the production of X-rays, and the progress in the development of optical elements for X-rays were fundamental for the further advancement of X-ray physics.
The pioneer work to the implementation of the phase-contrast method to X-ray physics was presented in 1965 by Ulrich Bonse and Michael Hart, Department of Materials Science and Engineering of Cornell University, New York. They presented a crystal interferometer, made from a large and highly perfect single crystal. Not less than 30 years later the Japanese scientists Atsushi Momose, Tohoru Takeda and co-workers adopted this idea and refined it for application in biological imaging, for instance by increasing the field of view with the assistance of new setup configurations and phase retrieval techniques. The Bonse–Hart interferometer provides several orders of magnitude higher sensitivity in biological samples than other phase-contrast techniques, but it cannot use conventional X-ray tubes because the crystals only accept a very narrow energy band of X-rays (ΔE/E ~ 10−4). In 2012, Han Wen and co-workers took a step forward by replacing the crystals with nanometric phase gratings. The gratings split and direct X-rays over a broad spectrum, thus lifting the restriction on the bandwidth of the X-ray source. They detected sub nanoradian refractive bending of X-rays in biological samples with a grating Bonse–Hart interferometer.
At the same time, two further approaches to phase-contrast imaging emerged with the aim to overcome the problems of crystal interferometry. The propagation-based imaging technique was primarily introduced by the group of Anatoly Snigirev at the ESRF (European Synchrotron Radiation Facility) in Grenoble, France, and was based on the detection of "Fresnel fringes" that arise under certain circumstances in free-space propagation. The experimental setup consisted of an inline configuration of an X-ray source, a sample and a detector and did not require any optical elements. It was conceptually identical to the setup of Dennis Gabor's revolutionary work on holography in 1948.
An alternative approach called analyzer-based imaging was first explored in 1995 by Viktor Ingal and Elena Beliaevskaya at the X-ray laboratory in Saint Petersburg, Russia, and by Tim Davis and colleagues at the CSIRO (Commonwealth Scientific and Industrial Research Organisation) Division of Material Science and Technology in Clayton, Australia. This method uses a Bragg crystal as angular filter to reflect only a small part of the beam fulfilling the Bragg condition onto a detector. Important contributions to the progress of this method have been made by a US collaboration of the research teams of Dean Chapman, Zhong Zhong and William Thomlinson, for example the extracting of an additional signal caused by ultra-small angle scattering and the first CT image made with analyzer-based imaging. An alternative to analyzer-based imaging, which provides equivalent results without requiring the use of a crystal, was developed by Alessandro Olivo and co-workers at the Elettra synchrotron in Trieste, Italy. This method, called “edge-illumination”, operates a fine selection on the X-ray direction by using the physical edge of the detector pixels themselves, hence the name. Later on Olivo, in collaboration with Robert Speller at University College London, adapted the method for use with conventional X-ray sources, opening the way to translation into clinical and other applications. Peter Munro (from the University of Western Australia) substantially contributed to the development of the lab-based approach, by demonstrating that it imposes practically no coherence requirements and that, this notwithstanding, it still is fully quantitative.
The latest approach discussed here is the so-called grating-based imaging, which makes use of the Talbot effect, discovered by Henry Fox Talbot in 1836. This self-imaging effect creates an interference pattern downstream of a diffraction grating. At a particular distance this pattern resembles exactly the structure of the grating and is recorded by a detector. The position of the interference pattern can be altered by bringing an object in the beam, that induces a phase shift. This displacement of the interference pattern is measured with the help of a second grating, and by certain reconstruction methods, information about the real part of the refractive index is gained. The so-called Talbot–Lau interferometer was initially used in atom interferometry, for instance by John F. Clauser and Shifang Li in 1994. The first X-ray grating interferometers using synchrotron sources were developed by Christian David and colleagues from the Paul Scherrer Institute (PSI) in Villingen, Switzerland and the group of Atsushi Momose from the University of Tokyo. In 2005, independently from each other, both David's and Momose's group incorporated computed tomography into grating interferometry, which can be seen as the next milestone in the development of grating-based imaging. In 2006, another great advancement was the transfer of the grating-based technique to conventional laboratory X-ray tubes by Franz Pfeiffer and co-workers, which fairly enlarged the technique's potential for clinical use. About two years later the group of Franz Pfeiffer also accomplished to extract a supplementary signal from their experiments; the so-called "dark-field signal" was caused by scattering due to the porous microstructure of the sample and provided "complementary and otherwise inaccessible structural information about the specimen at the micrometer and submicrometer length scale". At the same time, Han Wen and co-workers at the US National Institutes of Health arrived at a much simplified grating technique to obtain the scattering (“dark-field”) image. They used a single projection of a grid and a new approach for signal extraction named "single-shot Fourier analysis". Recently, a lot of research was done to improve the grating-based technique: Han Wen and his team analyzed animal bones and found out that the intensity of the dark-field signal depends on the orientation of the grid and this is due to the anisotropy of the bone structure. They made significant progress towards biomedical applications by replacing mechanical scanning of the gratings with electronic scanning of the X-ray source. The grating-based phase-contrast CT field was extended by tomographic images of the dark-field signal and time-resolved phase-contrast CT. Furthermore, the first pre-clinical studies using grating-based phase-contrast X-ray imaging were published. Marco Stampanoni and his group examined native breast tissue with "differential phase-contrast mammography", and a team led by Dan Stutman investigated how to use grating-based imaging for the small joints of the hand.
Most recently, a significant advance in grating-based imaging occurred due to the discovery of a phase moiré effect by Wen and colleagues. It led to interferometry beyond the Talbot self-imaging range, using only phase gratings and conventional sources and detectors. X-ray phase gratings can be made with very fine periods, thereby allowing imaging at low radiation doses to achieve high sensitivity.
Physical principle
Conventional X-ray imaging uses the drop in intensity through attenuation caused by an object in the X-ray beam and the radiation is treated as rays like in geometrical optics. But when X-rays pass through an object, not only their amplitude but their phase is altered as well. Instead of simple rays, X-rays can also be treated as electromagnetic waves. An object then can be described by its complex refractive index (cf.):
The term δ is the decrement of the real part of the refractive index, and the imaginary part β describes the absorption index or extinction coefficient. Note that in contrast to optical light, the real part of the refractive index is less than but close to unity, this is "due to the fact that the X-ray spectrum generally lies to the high-frequency side of various resonances associated with the binding of electrons". The phase velocity inside of the object is larger than the velocity of light c. This leads to a different behavior of X-rays in a medium compared to visible light (e.g. refractive angles have negative values) but does not contradict the law of relativity, "which requires that only signals carrying information do not travel faster than c. Such signals move with the group velocity, not with the phase velocity, and it can be shown that the group velocity is in fact less than c."
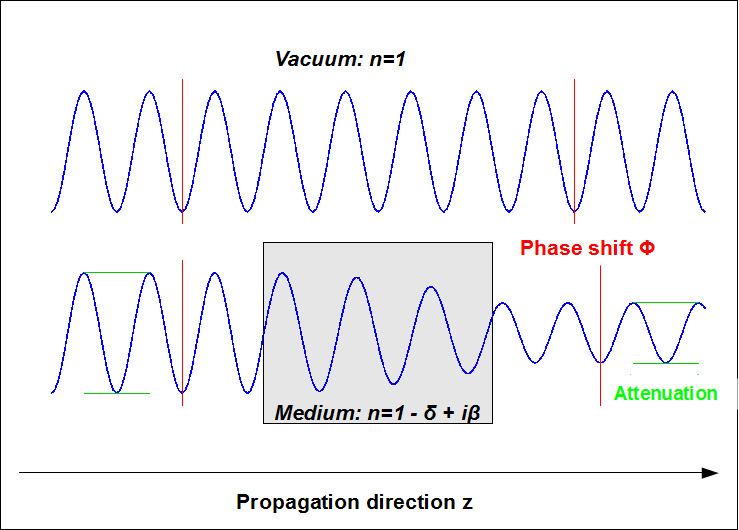
The impact of the index of refraction on the behavior of the wave can be demonstrated with a wave propagating in an arbitrary medium with a fixed refractive index n. For reason of simplicity, a monochromatic plane wave with no polarization is assumed here. The wave propagates in direction normal to the surface of the medium, named z in this example (see figure on the right). The scalar wave function in vacuum is
Within the medium, the angular wavenumber changes from k to nk. Now the wave can be described as:
where δkz is the phase shift and e−β kz is an exponential decay factor decreasing the amplitude E0 of the wave.
In more general terms, the total phase shift of the beam propagating a distance z can be calculated by using the integral
where λ is the wavelength of the incident X-ray beam. This formula means that the phase shift is the projection of the decrement of the real part of the refractive index in imaging direction. This fulfills the requirement of the tomographic principle, which states that "the input data to the reconstruction algorithm should be a projection of a quantity f that conveys structural information inside a sample. Then, one can obtain a tomogram which maps the value f." In other words, in phase-contrast imaging a map of the real part of the refraction index δ(x,y,z) can be reconstructed with standard techniques like filtered back projection which is analog to conventional X-ray computed tomography where a map of the imaginary part of the refraction index can be retrieved.
To get information about the compounding of a sample, basically the density distribution of the sample, one has to relate the measured values for the refractive index to intrinsic parameters of the sample, such a relation is given by the following formulas:
where ρa is the atomic number density, σa the absorption cross section, k the length of the wave vector and
where p the phase shift cross section.
Far from the absorption edges (peaks in the absorption cross-section due to the enhanced probability for the absorption of a photon that has a frequency close to the resonance frequency of the medium), dispersion effects can be neglected; this is the case for light elements (atomic number Z<40) that are the components of human tissue and X-ray energies above 20 keV, which are typically used in medical imaging. Assuming these conditions, the absorption cross section is approximately stated by
where 0.02 is a constant given in barn, the typical unit of particle interaction cross section area, k the length of the wave vector, k0 the length of a wave vector with wavelength of 1 Angstrom and Z the atomic number. The valid formula under these conditions for the phase shift cross section is:
where Z is the atomic number, k the length of the wave vector, and r0 the classical electron radius.
This results in the following expressions for the two parts of the complex index of refraction:
Inserting typical values of human tissue in the formulas given above shows that δ is generally three orders of magnitude larger than β within the diagnostic X-ray range. This implies that the phase-shift of an X-ray beam propagating through tissue may be much larger than the loss in intensity thus making PCI more sensitive to density variations in the tissue than absorption imaging.
Due to the proportionalities
the advantage of phase contrast over conventional absorption contrast even grows with increasing energy. Furthermore, because the phase contrast image formation is not intrinsically linked to the absorption of X-rays in the sample, the absorbed dose can potentially be reduced by using higher X-ray energies.
As mentioned above, concerning visible light, the real part of the refractive index n can deviate strongly from unity (n of glass in visible light ranges from 1.5 to 1.8) while the deviation from unity for X-rays in different media is generally of the order of 10−5. Thus, the refraction angles caused at the boundary between two isotropic media calculated with Snell's formula are also very small. The consequence of this is that refraction angles of X-rays passing through a tissue sample cannot be detected directly and are usually determined indirectly by "observation of the interference pattern between diffracted and undiffracted waves produced by spatial variations of the real part of the refractive index."
Crystal interferometry
Crystal interferometry, sometimes also called X-ray interferometry, is the oldest but also the most complex method used for experimental realization. It consists of three beam splitters in Laue geometry aligned parallel to each other. (See figure to the right) The incident beam, which usually is collimated and filtered by a monochromator (Bragg crystal) before, is split at the first crystal (S) by Laue diffraction into two coherent beams, a reference beam which remains undisturbed and a beam passing through the sample. The second crystal (T) acts as a transmission mirror and causes the beams to converge one towards another. The two beams meet at the plane of the third crystal (A), which is sometimes called, the analyzer crystal, and create an interference pattern the form of which depends on the optical path difference between the two beams caused by the sample. This interference pattern is detected with an X-ray detector behind the analyzer crystal.
By putting the sample on a rotation stage and recording projections from different angles, the 3D-distribution of the refractive index and thus tomographic images of the sample can be retrieved. In contrast to the methods below, with the crystal interferometer the phase itself is measured and not any spatial alternation of it. To retrieve the phase shift out of the interference patterns; a technique called phase-stepping or fringe scanning is used: a phase shifter (with the shape of a wedge) is introduced in the reference beam. The phase shifter creates straight interference fringes with regular intervals; so called carrier fringes. When the sample is placed in the other beam, the carrier fringes are displaced. The phase shift caused by the sample corresponds to the displacement of the carrier fringes. Several interference patterns are recorded for different shifts of the reference beam and by analyzing them the phase information modulo 2π can be extracted. This ambiguity of the phase is called the phase wrapping effect and can be removed by so-called "phase unwrapping techniques". These techniques can be used when the signal-to-noise ratio of the image is sufficiently high and phase variation is not too abrupt.
As an alternative to the fringe scanning method, the Fourier-transform method can be used to extract the phase shift information with only one interferogram, thus shortening the exposure time, but this has the disadvantage of limiting the spatial resolution by the spacing of the carrier fringes.
X-ray interferometry is considered to be the most sensitive to the phase shift, of the 4 methods, consequently providing the highest density resolution in range of mg/cm3. But due to its high sensitivity, the fringes created by a strongly phase-shifting sample may become unresolvable; to overcome this problem a new approach called "coherence-contrast X-ray imaging" has been developed recently, where instead of the phase shift the change of the degree of coherence caused by the sample is relevant for the contrast of the image.
A general limitation to the spatial resolution of this method is given by the blurring in the analyzer crystal which arises from dynamical refraction, i.e. the angular deviation of the beam due to the refraction in the sample is amplified about ten thousand times in the crystal, because the beam path within the crystal depends strongly on its incident angle. This effect can be reduced by thinning down the analyzer crystal, e.g. with an analyzer thickness of 40 μm a resolution of about 6 μm was calculated. Alternatively the Laue crystals can be replaced by Bragg crystals, so the beam doesn´t pass through the crystal but is reflected on the surface.
Another constraint of the method is the requirement of a very high stability of the setup; the alignment of the crystals must be very precise and the path length difference between the beams should be smaller than the wavelength of the X-rays; to achieve this the interferometer is usually made out of a highly perfect single block of silicon by cutting out two grooves. By the monolithic production the very important spatial lattice coherence between all three crystals can be maintained relatively well but it limits the field of view to a small size,(e.g. 5 cm x 5 cm for a 6-inch ingot) and because the sample is normally placed in one of the beam paths the size of the sample itself is also constrained by the size of the silicon block. Recently developed configurations, using two crystals instead of one, enlarge the field of view considerably, but are even more sensitive to mechanical instabilities.
Another additional difficulty of the crystal interferometer is that the Laue crystals filter most of the incoming radiation, thus requiring a high beam intensity or very long exposure times. That limits the use of the method to highly brilliant X-ray sources like synchrotrons.
According to the constraints on the setup the crystal interferometer works best for high-resolution imaging of small samples which cause small or smooth phase gradients.
Grating Bonse-Hart (interferometry)
To have the superior sensitivity of crystal Bonse-Hart interferometry without some of the basic limitations, the monolithic crystals have been replaced with nanometric x-ray phase-shift gratings. The first such gratings have periods of 200 to 400 nanometers. They can split x-ray beams over the broad energy spectra of common x-ray tubes. The main advantage of this technique is that it uses most of the incoming x-rays that would have been filtered by the crystals. Because only phase gratings are used, grating fabrication is less challenging than techniques that use absorption gratings. The first grating Bonse-Hart interferometer (gBH) operated at 22.5 keV photon energy and 1.5% spectral bandwidth.
The incoming beam is shaped by slits of a few tens of micrometers such that the transverse coherence length is greater than the grating period. The interferometer consists of three parallel and equally spaced phase gratings, and an x-ray camera. The incident beam is diffracted by a first grating of period 2P into two beams. These are further diffracted by a second grating of period P into four beams. Two of the four merge at a third grating of period 2P. Each is further diffracted by the third grating. The multiple diffracted beams are allowed to propagate for sufficient distance such that the different diffraction orders are separated at the camera. There exists a pair of diffracted beams that co-propagate from the third grating to the camera. They interfere with each other to produce intensity fringes if the gratings are slightly misaligned with each other. The central pair of diffraction paths are always equal in length regardless of the x-ray energy or the angle of the incident beam. The interference patterns from different photon energes and incident angles are locked in phase.
The imaged object is placed near the central grating. Absolute phase images are obtained if the object intersects one of a pair of coherent paths. If the two paths both pass through the object at two locations which are separated by a lateral distance d, then a phase difference image of Φ(r) - Φ(r-d) is detected. Phase stepping one of the gratings is performed to retrieve the phase images. The phase difference image Φ(r) - Φ(r-d) can be integrated to obtain a phase shift image of the object.
This technique achieved substantially higher sensitivity than other techniques with the exception of the crystal interferometer. A basic limitation of the technique is the chromatic dispersion of grating diffraction, which limits its spatial resolution. A tabletop system with a tungsten-target x-ray tube running at 60 kVp will have a limiting resolution of 60 µm. Another constraint is that the x-ray beam is slitted down to only tens of micrometers wide. A potential solution has been proposed in the form of parallel imaging with multiple slits.
Analyzer-based imaging
Analyzer-based imaging (ABI) is also known as diffraction-enhanced imaging (DEI), phase-dispersion Introscopy and multiple-image radiography (MIR) Its setup consists of a monochromator (usually a single or double crystal that also collimates the beam) in front of the sample and an analyzer crystal positioned in Bragg geometry between the sample and the detector. (See figure to the right)
This analyzer crystal acts as an angular filter for the radiation coming from the sample. When these X-rays hit the analyzer crystal the condition of Bragg diffraction is satisfied only for a very narrow range of incident angles. When the scattered or refracted X-rays have incident angles outside this range they will not be reflected at all and don´t contribute to the signal. Refracted X-rays within this range will be reflected depending on the incident angle. The dependency of the reflected intensity on the incident angle is called a rocking curve and is an intrinsic property of the imaging system, i.e. it represents the intensity measured at each pixel of the detector when the analyzer crystal is "rocked" (slightly rotated in angle θ) with no object present and thus can be easily measured. The typical angular acceptance is from a few microradians to tens of microradians and is related to the full width at half maximum (FWHM) of the rocking curve of the crystal.
When the analyzer is perfectly aligned with the monochromator and thus positioned to the peak of the rocking curve, a standard X-ray radiograph with enhanced contrast is obtained because there is no blurring by scattered photons. Sometimes this is referred to as "extinction contrast".
If, otherwise, the analyzer is oriented at a small angle (detuning angle) with respect to the monochromator then X-rays refracted in the sample by a smaller angle will be reflected less, and X-rays refracted by a larger angle will be reflected more. Thus the contrast of the image is based on different refraction angles in the sample. For small phase gradients the refraction angle can be expressed as
where k is the length of the wave vector of the incident radiation and the second term on the right hand side is the first derivative of the phase in the diffraction direction. Since not the phase itself, but the first derivative of the phase front is measured, ABI is less sensitive to low spatial frequencies than crystal interferometry but more sensitive than PBI.
Contrary to the former methods ABI usually provides phase information only in the diffraction direction, but is not sensitive to angular deviations on the plane perpendicular to the diffraction plane. This sensitivity to only one component of the phase gradient can lead to ambiguities in phase estimation.
By recording several images at different detuning angles, meaning at different positions on the rocking curve, a data set is gained which allows the retrieval of quantitative differential phase information. There are several algorithms to reconstruct information from the rocking curves, some of them provide an additional signal. This signal comes from Ultra-small-angle scattering by sub-pixel sample structures and causes angular broadening of the beam and hence a broadening of the shape of the rocking curve. Based on this scattering contrast a new kind of image called Dark-field image can be produced.
Tomographic imaging with ABI can be done by fixing the analyzer at a specific angle and rotating the sample through 360° while the projection data are acquired. Several sets of projections are acquired from the same sample with different detuning angles and then a tomographic image can be reconstructed. Assuming that the crystals are normally aligned such that the derivative of the refractive index is measured in the direction parallel to the tomographic axis, the resulting "refraction CT image" shows the pure image of the out-of-plane gradient.
For ABI the stability requirements of the crystals is less strict than for crystal interferometry but the setup still requires a perfect analyzer crystal that needs to be very precisely controlled in angle and the size of the analyzer crystal and the constraint that the beam needs to be parallel also limits the field of view. Additionally as in crystal interferometry a general limitation for the spatial resolution of this method is given by the blurring in the analyzer crystal due to dynamic diffraction effects, but can be improved by using grazing incidence diffraction for the crystal.
While the method in principle requires monochromatic, highly collimated radiation and hence is limited to a synchrotron radiation source, it was shown recently that the method remains feasible using a laboratory source with a polychromatic spectrum when the rocking curve is adapted to the K α spectral line radiation of the target material.
Due to its high sensitivity to small changes in the refraction index this method is well suited to image soft tissue samples and is already implemented to medical imaging, especially in Mammography for a better detection of microcalcifications and in bone cartilage studies.
Propagation-based imaging
Propagation-based imaging (PBI) is the most common name for this technique but it is also called in-line holography, refraction-enhanced imaging or phase-contrast radiography. The latter denomination derives from the fact that the experimental setup of this method is basically the same as in conventional radiography. It consists of an in-line arrangement of an X-ray source, the sample and an X-ray detector and no other optical elements are required. The only difference is that the detector is not placed immediately behind the sample, but in some distance, so the radiation refracted by the sample can interfere with the unchanged beam. This simple setup and the low stability requirements provides a big advantage of this method over other methods discussed here.
Under spatially coherent illumination and an intermediate distance between sample and detector an interference pattern with "Fresnel fringes" is created; i.e. the fringes arise in the free space propagation in the Fresnel regime, which means that for the distance between detector and sample the approximation of Kirchhoff's diffraction formula for the near field, the Fresnel diffraction equation is valid. In contrast to crystal interferometry the recorded interference fringes in PBI are not proportional to the phase itself but to the second derivative (the Laplacian) of the phase of the wavefront. Therefore, the method is most sensitive to abrupt changes in the decrement of the refractive index. This leads to stronger contrast outlining the surfaces and structural boundaries of the sample (edge enhancement) compared with a conventional radiogram.
PBI can be used to enhance the contrast of an absorption image, in this case the phase information in the image plane is lost but contributes to the image intensity (edge enhancement of attenuation image). However it is also possible to separate the phase and the attenuation contrast, i.e. to reconstruct the distribution of the real and imaginary part of the refractive index separately. The unambiguous determination of the phase of the wave front (phase retrieval) can be realized by recording several images at different detector-sample distances and using algorithms based on the linearization of the Fresnel diffraction integral to reconstruct the phase distribution, but this approach suffers from amplified noise for low spatial frequencies and thus slowly varying components may not be accurately recovered. There are several more approaches for phase retrieval and a good overview about them is given in.
Tomographic reconstructions of the 3D distribution of the refractive index or "Holotomography" is implemented by rotating the sample and recording for each projection angle a series of images at different distances.
A high resolution detector is required to resolve the interference fringes, which practically limits the field of view of this technique or requires larger propagation distances. The achieved spatial resolution is relatively high in comparison to the other methods and, since there are no optical elements in the beam, is mainly limited by the degree of spatial coherence of the beam. As mentioned before, for the formation of the Fresnel fringes, the constraint on the spatial coherence of the used radiation is very strict, which limits the method to small or very distant sources, but in contrast to crystal interferometry and analyzer-based imaging the constraint on the temporal coherence, i.e. the polychromaticity is quite relaxed. Consequently, the method cannot only be used with synchrotron sources but also with polycromatic laboratory X-ray sources providing sufficient spatial coherence, such as microfocus X-ray tubes.
Generally spoken, the image contrast provided by this method is lower than of other methods discussed here, especially if the density variations in the sample are small. Due to its strength in enhancing the contrast at boundaries, it's well suited for imaging fiber or foam samples. A very important application of PBI is the examination of fossils with synchrotron radiation, which reveals details about the paleontological specimens which would otherwise be inaccessible without destroying the sample.
Grating-based imaging
Grating-based imaging (GBI) includes Shearing interferometry or X-ray Talbot interferometry (XTI), and polychromatic far-field interferometry (PFI). Since the first X-ray grating interferometer—consisting of two phase gratings and an analyzer crystal—was built, various slightly different setups for this method have been developed; in the following the focus lies on the nowadays standard method consisting of a phase grating and an analyzer grating. (See figure to the right).
The XTI technique is based on the Talbot effect or "self-imaging phenomenon", which is a Fresnel diffraction effect and leads to repetition of a periodic wavefront after a certain propagation distance, called the "Talbot length". This periodic wavefront can be generated by spatially coherent illumination of a periodic structure, like a diffraction grating, and if so the intensity distribution of the wave field at the Talbot length resembles exactly the structure of the grating and is called a self-image. It has also been shown that intensity patterns will be created at certain fractional Talbot lengths. At half the distance the same intensity distribution appears except for a lateral shift of half the grating period while at certain smaller fractional Talbot distances the self-images have fractional periods and fractional sizes of the intensity maxima and minima, that become visible in the intensity distribution behind the grating, a so-called Talbot carpet. The Talbot length and the fractional lengths can be calculated by knowing the parameters of the illuminating radiation and the illuminated grating and thus gives the exact position of the intensity maxima, which needs to be measured in GBI. While the Talbot effect and the Talbot interferometer were discovered and extensively studied by using visible light it has been demonstrated several years ago for the hard X-ray regime as well.
In GBI a sample is placed before or behind the phase grating (lines of the grating show negligible absorption but substantial phase shift) and thus the interference pattern of the Talbot effect is modified by absorption, refraction and scattering in the sample. For a phase object with a small phase gradient the X-ray beam is deflected by
where k is the length of the wave vector of the incident radiation and the second factor on the right hand side is the first derivative of the phase in the direction perpendicular to the propagation direction and parallel to the alignment of the grating. Since the transverse shift of the interference fringes is linear proportional to the deviation angle the differential phase of the wave front is measured in GBI, similar as in ABI. In other words, the angular deviations are translated into changes of locally transmitted intensity. By performing measurements with and without sample the change in position of the interference pattern caused by the sample can be retrieved. The period of the interference pattern is usually in the range of a few micrometers, which can only be conveniently resolved by a very high resolution detector in combination with a very intense illumination ( a source providing a very high flux) and hence limits the field of view significantly . This is the reason why a second grating, typically an absorption grating, is placed at a fractional Talbot length to analyze the interference pattern.
The analyzer grating does normally have the same period as the interference fringes and thus transforms local fringe position into signal intensity variation on the detector, which is placed immediately behind the grating. In order to separate the phase information from other contributions to the signal, a technique called "phase-stepping" is used. One of the gratings is scanned along the transverse direction term xg; over one period of the grating, and for different positions of the grating an image is taken. The intensity signal in each pixel in the detector plane oscillates as a function of xg. The recorded intensity oscillation can be represented by a Fourier series and by recording and comparing these intensity oscillations with or without the sample the separated differential phase shift and absorption signal relative to the reference image can be extracted. As in ABI an additional signal coming from Ultra-small-angle scattering by sub-pixel microstructures of the sample, called dark-field contrast, can also be reconstructed. This method provides high spatial resolution, but also requires long exposure times.
An alternative approach is the retrieval of the differential phase by using Moiré fringes. These are created as a superposition of the self-image of G1 and the pattern of G2 by using gratings with the same periodicity and inclining G2 against G1 regarding to the optical axis with a very small angle(<<1). This moiré fringes act as carrier fringes because they have a much larger spacing/period (smaller spatial frequency) than the Talbot fringes and thus the phase gradient introduced by the sample can be detected as the displacement of the Moiré fringes. With a Fourier analysis of the Moiré pattern the absorption and dark-field signal can also be extracted. Using this approach, the spatial resolution is lower than one achieved by the phase-stepping technique, but the total exposure time can be much shorter, because a differential phase image can be retrieved with only one Moiré pattern. Single-shot Fourier analysis technique was used in early grid-based scattering imaging similar to the shack-Hartmann wavefront sensor in optics, which allowed first live animal studies.
A technique to eliminate mechanical scanning of the grating and still retain the maximum spatial resolution is electronic phase stepping. It scans the source spot of the x-ray tube with an electro-magnetic field. This causes the projection of the object to move in the opposite direction, and also causes a relative movement between the projection and the Moiré fringes. The images are digitally shifted to realign the projections. The end result is that the projection of the object is stationary, while the Moiré fringes move over it. This technique effectively synthesizes the phase stepping process, but without the costs and delays associated with mechanical movements.
With both of these phase-extraction methods tomography is applicable by rotating the sample around the tomographic axis, recording a series of images with different projection angles and using back projection algorithms to reconstruct the 3-dimensional distributions of the real and imaginary part of the refractive index. Quantitative tomographic reconstruction of the dark-field signal has also been demonstrated for the phase-stepping technique and very recently for the Moiré pattern approach as well.
It has also been demonstrated that dark-field imaging with the grating interferometer can be used to extract orientational information of structural details in the sub-micrometer regime beyond the spatial resolution of the detection system. While the scattering of X-rays in a direction perpendicular to the grating lines provides the dark-field contrast, the scattering in a direction parallel to the grating lines only lead to blurring in the image, which is not visible at the low resolution of the detector. This intrinsic physical property of the setup is utilized to extract orientational information about the angular variation of the local scattering power of the sample by rotating the sample around the optical axis of the set-up and collecting a set of several dark-field images, each measuring the component of the scattering perpendicular to the grating lines for that particular orientation. This can be used to determine the local angle and degree of orientation of bone and could yield valuable information for improving research and diagnostics of bone diseases like osteoporosis or osteoarthritis.
The standard configuration as shown in the figure to the right requires spatial coherence of the source and consequently is limited to high brilliant synchrotron radiation sources. This problem can be handled by adding a third grating close to the X-ray source, known as a Talbot-Lau interferometer. This source grating, which is usually an absorption grating with transmission slits, creates an "array of individually coherent but mutually incoherent sources". As the source grating can contain a large number of individual apertures, each creating a sufficiently coherent virtual line source, standard X-ray generators with source sizes of a few square millimeters can be used efficiently and the field of view can be significantly increased.
Since the position of the interference fringes formed behind the beam-splitter grating is independent of wavelength over a wide energy range of the incident radiation the interferometer in phase-stepping configuration can still be used efficiently with polychromatic radiation. For the Moiré pattern configuration the constraint on the radiation energy is a bit stricter, because a finite bandwidth of energy instead of monochromatic radiation causes a decrease in the visibility of the Moiré fringes and thus the image quality, but a moderate polychromaticity is still allowed. A great advantage of the usage of polychromatic radiation is the shortening of the exposure times and this has recently been exploited by using white synchrotron radiation to realize the first dynamic (time-resolved) Phase contrast tomography.
A technical barrier to overcome is the fabrication of gratings with high aspect ratio and small periods. The production of these gratings out of a silicon wafer involves microfabrication techniques like photolithography, anisotropic wet etching, electroplating and molding. A very common fabrication process for X-ray gratings is LIGA, which involves several of the microfabrication techniques mentioned above and was invented in the 1980s by German scientists of the Karlsruhe Institute of Technology (KIT). Another technical requirement is the stability, and precise alignment and movement of the gratings (typically in the range of some nm), but compared to other methods, e.g. the crystal interferometer the constraint is easy to fulfill.
The grating fabrication challenge was eased by the discovery of a phase moiré effect which provides an all-phase-grating interferometer that works with compact sources, called the polychromatic far-field interferometer (see figure on the right). Phase gratings are easier to make when compared with the source and analyzer gratings mentioned above, since the grating depth required to cause phase shift is much less than what is needed to absorb x-rays. Phase gratings of 200 - 400 nanometer periods have been used to improve phase sensitivity in table-top PFI imagers. In PFI a phase grating is used to convert the fine interference fringes into a broad intensity pattern at a distal plane, based on the phase moiré effect. Besides higher sensitivity, another incentive for smaller grating periods is that the lateral coherence of the source needs to be at least one grating period.
A disadvantage of the standard GBI setup is the sensitivity to only one component of the phase gradient, which is the direction parallel to the 1-D gratings. This problem has been solved either by recording differential phase contrast images of the sample in both direction x and y by turning the sample (or the gratings) by 90° or by the employment of two-dimensional gratings.
Being a differential phase technique, GBI is not as sensitive as crystal interferometry to low spatial frequencies, but because of the high resistance of the method against mechanical instabilities, the possibility of using detectors with large pixels and a large field of view and, of crucial importance, the applicability to conventional laboratory X-ray tubes, grating-based imaging is a very promising technique for medical diagnostics and soft tissue imaging. First medical applications like a pre-clinical mammography study, show great potential for the future of this technique. Beyond that GBI has applications in a wide field of material science, for instance it could be used to improve security screening.
Edge-illumination
Edge-illumination (EI) was developed at the Italian synchrotron (Elettra) in the late ‘90s, as an alternative to ABI. It is based on the observation that, by illuminating only the edge of detector pixels, high sensitivity to phase effects is obtained (see figure).
Also in this case, the relation between X-ray refraction angle and first derivative of the phase shift caused by the object is exploited:
If the X-ray beam is vertically thin and impinges on the edge of the detector, X-ray refraction can change the status of the individual X-ray from “detected” to “undetected” and vice versa, effectively playing the same role as the crystal rocking curve in ABI. This analogy with ABI, already observed when the method was initially developed, was more recently formally demonstrated. Effectively, the same effect is obtained – a fine angular selection on the photon direction; however, while in ABI the beam needs to be highly collimated and monochromatic, the absence of the crystal means that EI can be implemented with divergent and polychromatic beams, like those generated by a conventional rotating-anode X-ray tube. This is done by introducing two opportunely designed masks (sometimes referred to as “coded-aperture” masks), one immediately before the sample, and one in contact with the detector (see figure).
The purpose of the latter mask is simply to create insensitive regions between adjacent pixels, and its use can be avoided if specialized detector technology is employed. In this way, the EI configuration is simultaneously realized for all pixel rows of an area detector. This plurality of individual beamlets means that no scanning is required – the sample is placed downstream of the sample mask and imaged in a single shot (two if phase retrieval is performed). Although the set-up perhaps superficially resembles that of a grating interferometer, the underpinning physical mechanism is different. GI is an intrinsically coherent method, in which an incoherent source can be used only provided it is made sufficiently coherent through collimation via the source grating. In contrast, EI is an incoherent technique, and was in fact proven to work with both spatially and temporally incoherent sources, without any additional source aperturing or collimation. Quantitative phase retrieval was also demonstrated with (uncollimated) incoherent sources, showing that in some cases results analogous to the synchrotron gold standard can be obtained. The highly simplified set-up, which however does not lead to reduced phase sensitivity, results in a number of advantages, which include reduced exposure time for the same source power, reduced radiation dose, robustness against environmental vibrations, and easier access to high X-ray energy. Moreover, since their aspect ratio is not particularly demanding, masks are cheap, easy to fabricate (e.g.do not require X-ray lithography) and can already be scaled to large areas. The method is easily extended to phase sensitivity in two directions, for example, through the realization of L-shaped apertures for the simultaneous illumination of two orthogonal edges in each detector pixel. More generally, while in its simplest implementation beamlets match individual pixel rows (or pixels), the method is highly flexible, and, for example, sparse detectors and asymmetric masks can be used. So far, the method has been successfully demonstrated in areas such as security scanning, biological imaging, material science, paleontology and others; adaptation to 3D (computed tomography) was also demonstrated. Alongside simple translation for use with conventional x-ray sources, there are substantial benefits in the implementation of EI with coherent synchrotron radiation, among which high performance at very high X-ray energies and angular resolutions higher than in other approaches.