
Written in Delphi Available in English | Operating system Type Statistical software | |
 | ||
Developer(s) Institute for Land Reclamation and Improvement (ILRI) | ||
In statistics and data analysis the application software CumFreq is a free and user-friendly tool for cumulative frequency analysis of a single variable and for probability distribution fitting.
Contents
- Software features
- Generalizing distributions
- Inverting distributions
- Shifting distributions
- Confidence belts
- References
Originally the method was developed for the analysis of hydrological measurements of spatially varying magnitudes (e.g. hydraulic conductivity of the soil) and of magnitudes varying in time (e.g. rainfall, river discharge) to find their return periods. However, it can be used for many other types of phenomena, including those that contain negative values.
Software features
CumFreq uses the plotting position approach to estimate the cumulative frequency of each of the observed magnitudes in a data series of the variable.
The computer program allows determination of the best fitting probability distribution. Alternatively it provides the user with the option to select the probability distribution to be fitted. The following probability distributions are included: normal, lognormal, logistic, loglogistic, exponential, Cauchy, Fréchet, Gumbel, Pareto, Weibull and others.
Another characteristic of CumFreq is that it provides the option to use two different probability distributions, one for the lower data range, and one for the higher. The ranges are separated by a break-point. The use of discontinuous probability distributions can be useful when the data of the phenomenon studied were obtained under different conditions.
During the input phase, the user can select the number of intervals needed to determine the histogram. He may also define a threshold to obtain a truncated distribution.
The output section provides a calculator to facilitate interpolation and extrapolation.
Further it gives the option to see the Q–Q plot in terms of calculated and observed cumulative frequencies.
ILRI provides examples of application to magnitudes like crop yield, watertable depth, soil salinity, hydraulic conductivity, rainfall, and river discharge.
Generalizing distributions
The program can produce generalizations of the normal, logistic, and other distributions by transforming the data using an exponent that is optimized to obtain the best fit.
This feature is not common in other distribution-fitting software which normally include only a logarithmic transformation of data obtaining distributions like the lognormal and loglogistic.
Generalization of symmetrical distributions (like the normal and the logistic) makes them applicable to data obeying a distribution that is skewed to the right (using an exponent <1) as well as to data obeying a distribution that is skewed to the left (using an exponent >1). This enhances the versatility of symmetrical distributions.
Inverting distributions
Skew distributions can be mirrored by distribution inversion to change the skewness from positive to negative and vice versa. This amplifies the number of applicable distributions and increases the chance of finding a better fit. CumFreq makes use of that opportunity.
Shifting distributions
When negative data are present that are not supported by a probability distribution, the model performs a distribution shift to the positive side while, after fitting, the distribution is shifted back.
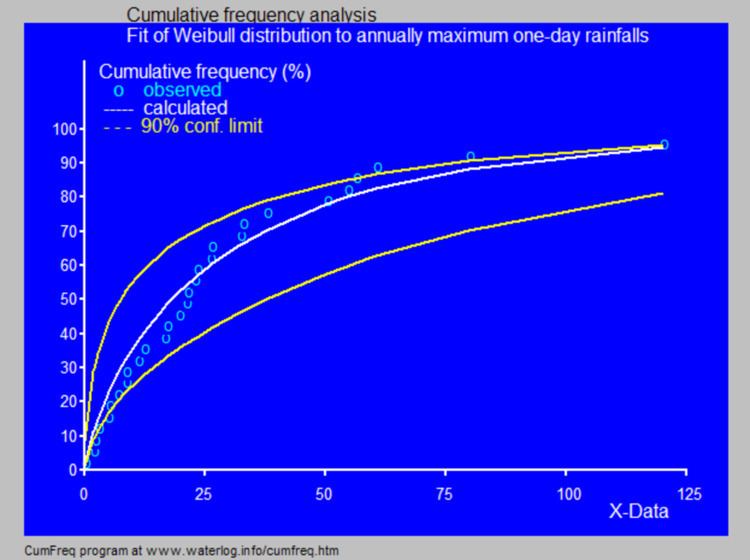
Confidence belts
The software employs the binomial distribution to determine the confidence belt of the corresponding cumulative distribution function.
The prediction of the return period, which is of interest in time series, is also accompanied by a confidence belt. The construction of confidence belts is not found in most other software.
The figure to the right shows the variation that may occur when obtaining samples of a variate that follows a certain probability distribution. The data were provided by Benson.
The confidence belt around an experimental cumulative frequency or return period curve gives an impression of the region in which the true distribution may be found.
Also, it clarifies that the experimentally found best fitting probability distribution may deviate from the true distribution.