
 | ||
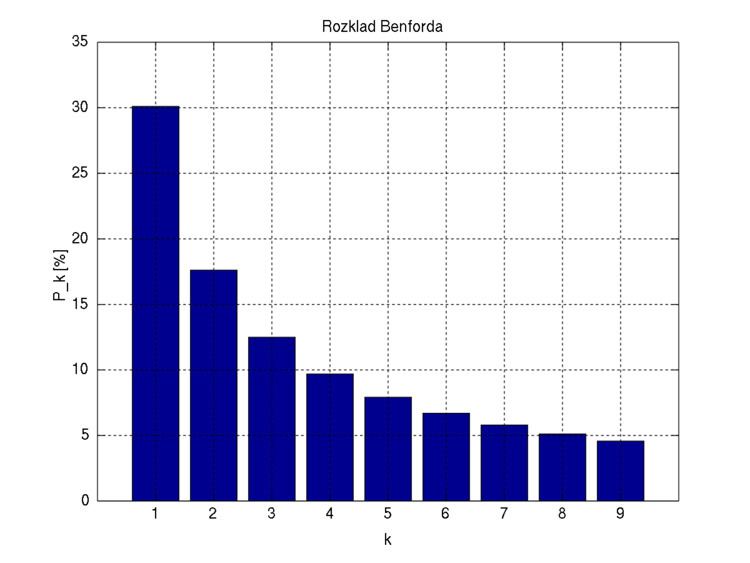
Benford's law, also called the first-digit law, is an observation about the frequency distribution of leading digits in many real-life sets of numerical data. The law states that in many naturally occurring collections of numbers, the leading significant digit is likely to be small. For example, in sets which obey the law, the number 1 appears as the most significant digit about 30% of the time, while 9 appears as the most significant digit less than 5% of the time. By contrast, if the digits were distributed uniformly, they would each occur about 11.1% of the time. Benford's law also makes (different) predictions about the distribution of second digits, third digits, digit combinations, and so on.
Contents
- Mathematical statement
- Benfords law in other bases
- Example
- History
- Explanations
- Overview
- Multiplicative fluctuations
- Multiple probability distributions
- Accounting fraud detection
- Legal status
- Election data
- Macroeconomic data
- Price digit analysis
- Genome data
- Scientific fraud detection
- Statistical tests
- Generalization to digits beyond the first
- Tests with common distributions
- Distributions known to obey Benfords law
- Distributions known to not obey Benfords law
- Criteria for distributions expected and not expected to obey Benfords Law
- Distributions that can be expected to obey Benfords Law
- Distributions that would not be expected to obey Benfords Law
- Moments
- References
It has been shown that this result applies to a wide variety of data sets, including electricity bills, street addresses, stock prices, house prices, population numbers, death rates, lengths of rivers, physical and mathematical constants, and processes described by power laws (which are very common in nature). It tends to be most accurate when values are distributed across multiple orders of magnitude.
The graph here shows Benford's law for base 10. There is a generalization of the law to numbers expressed in other bases (for example, base 16), and also a generalization from leading 1 digit to leading n digits.
It is named after physicist Frank Benford, who stated it in 1938, although it had been previously stated by Simon Newcomb in 1881.
Benford's law is a special case of Zipf's law.
Mathematical statement
A set of numbers is said to satisfy Benford's law if the leading digit d (d ∈ {1, ..., 9}) occurs with probability
Numerically, the leading digits have the following distribution in Benford's law, where d is the leading digit and P (d ) the probability:
The quantity P(d ) is proportional to the space between d and d + 1 on a logarithmic scale. Therefore, this is the distribution expected if the mantissae of the logarithms of the numbers (but not the numbers themselves) are uniformly and randomly distributed.
For example, a number x, constrained to lie between 1 and 10, starts with the digit 1 if 1 ≤ x < 2, and starts with the digit 9 if 9 ≤ x < 10. Therefore, x starts with the digit 1 if log 1 ≤ log x < log 2, or starts with 9 if log 9 ≤ log x < log 10. The interval [log 1, log 2] is much wider than the interval [log 9, log 10] (0.30 and 0.05 respectively); therefore if logx is uniformly and randomly distributed, it is much more likely to fall into the wider interval than the narrower interval, i.e. more likely to start with 1 than with 9. The probabilities are proportional to the interval widths, and this gives the equation above. (The above discussion assumed x is between 1 and 10, but the result is the same no matter how many digits x has before the decimal point.)
Benford's law in other bases
An extension of Benford's law predicts the distribution of first digits in other bases besides decimal; in fact, any base b ≥ 1. The general form is:
For b = 2 (the binary number system), Benford's law is true but trivial: All binary numbers (except for 0) start with the digit 1. (On the other hand, the generalization of Benford's law to second and later digits is not trivial, even for binary numbers.)
Example
Examining a list of the heights of the 60 tallest structures in the world by category shows that 1 is by far the most common leading digit, irrespective of the unit of measurement (cf. "scale invariance", below):
Another example is the leading digit of 2n:
1, 2, 4, 8, 1, 3, 6, 1, 2, 5, 1, 2, 4, 8, 1, 3, 6, 1... (sequence A008952 in the OEIS)
History
The discovery of Benford's law goes back to 1881, when the American astronomer Simon Newcomb noticed that in logarithm tables the earlier pages (that started with 1) were much more worn than the other pages. Newcomb's published result is the first known instance of this observation and includes a distribution on the second digit, as well. Newcomb proposed a law that the probability of a single number N being the first digit of a number was equal to log(N + 1) − log(N).
The phenomenon was again noted in 1938 by the physicist Frank Benford, who tested it on data from 20 different domains and was credited for it. His data set included the surface areas of 335 rivers, the sizes of 3259 US populations, 104 physical constants, 1800 molecular weights, 5000 entries from a mathematical handbook, 308 numbers contained in an issue of Reader's Digest, the street addresses of the first 342 persons listed in American Men of Science and 418 death rates. The total number of observations used in the paper was 20,229. This discovery was later named after Benford (making it an example of Stigler's Law).
In 1995, Ted Hill proved the result about mixed distributions mentioned below.
Explanations
Arno Berger and Ted Hill have stated that, "The widely known phenomenon called Benford’s law continues to defy attempts at an easy derivation".
However, limited explanations of Benford's law have been offered, including the following.
Overview
Benford's law states that the fractional part of the logarithm of the data is uniformly distributed between 0 and 1. It tends to apply most accurately to data that are distributed uniformly across many orders of magnitude. As a rule, the more orders of magnitude that the data evenly covers, the more accurately Benford's law applies.
For instance, one can expect that Benford's law would apply to a list of numbers representing the populations of UK villages, or representing the values of small insurance claims. But if a "village" is defined as a settlement with population between 300 and 999, or a "small insurance claim" is defined as a claim between $50 and $99, then Benford's law will not apply.
Consider the probability distributions shown below, referenced to a log scale. In each case, the total area in red is the relative probability that the first digit is 1, and the total area in blue is the relative probability that the first digit is 8.
For the left distribution, the size of the areas of red and blue are approximately proportional to the widths of each red and blue bar. Therefore, the numbers drawn from this distribution will approximately follow Benford's law. On the other hand, for the right distribution, the ratio of the areas of red and blue is very different from the ratio of the widths of each red and blue bar. Rather, the relative areas of red and blue are determined more by the height of the bars than the widths. Accordingly, the first digits in this distribution do not satisfy Benford's law at all.
Thus, real-world distributions that span several orders of magnitude rather uniformly (e.g. populations of villages / towns / cities, stock-market prices), are likely to satisfy Benford's law to a very high accuracy. On the other hand, a distribution that is mostly or entirely within one order of magnitude (e.g. heights of human adults, or IQ scores) is unlikely to satisfy Benford's law very accurately, or at all. However, it is not a sharp line: As the distribution gets narrower, the discrepancies from Benford's law typically increase gradually.
In terms of conventional probability density (referenced to a linear scale rather than log scale, i.e. P(x)dx rather than P(log x) d(log x)), the equivalent criterion is that Benford's law will be very accurately satisfied when P(x) is approximately proportional to 1/x over several orders-of-magnitude variation in x.
This discussion is not a full explanation of Benford's law, because we have not explained why we so often come across data-sets that, when plotted as a probability distribution of the logarithm of the variable, are relatively uniform over several orders of magnitude.
Multiplicative fluctuations
Many real-world examples of Benford's law arise from multiplicative fluctuations. For example, if a stock price starts at $100, and then each day it gets multiplied by a randomly chosen factor between 0.99 and 1.01, then over an extended period the probability distribution of its price satisfies Benford's law with higher and higher accuracy.
The reason is that the logarithm of the stock price is undergoing a random walk, so over time its probability distribution will get more and more broad and smooth (see above). (More technically, the central limit theorem says that multiplying more and more random variables will create a log-normal distribution with larger and larger variance, so eventually it covers many orders of magnitude almost uniformly.)
Unlike multiplicative fluctuations, additive fluctuations do not lead to Benford's law: They lead instead to normal probability distributions (again by the central limit theorem), which do not satisfy Benford's law. For example, the "number of heartbeats that I experience on a given day" can be written as the sum of many random variables (e.g. the sum of heartbeats per minute over all the minutes of the day), so this quantity is unlikely to follow Benford's law. By contrast, that hypothetical stock price described above can be written as the product of many random variables (i.e. the price change factor for each day), so is likely to follow Benford's law quite well.
Multiple probability distributions
For numbers drawn from certain distributions (IQ scores, human heights) the Law fails to hold because these variates obey a normal distribution which is known not to satisfy Benford's law, since normal distributions can't span several orders of magnitude and the mantissae of their logarithms will not be (even approximately) uniformly distributed.
However, if one "mixes" numbers from those distributions, for example by taking numbers from newspaper articles, Benford's law reappears. This can also be proven mathematically: if one repeatedly "randomly" chooses a probability distribution (from an uncorrelated set) and then randomly chooses a number according to that distribution, the resulting list of numbers will obey Benford's Law. A similar probabilistic explanation for the appearance of Benford's Law in everyday-life numbers has been advanced by showing that it arises naturally when one considers mixtures of uniform distributions.
Accounting fraud detection
In 1972, Hal Varian suggested that the law could be used to detect possible fraud in lists of socio-economic data submitted in support of public planning decisions. Based on the plausible assumption that people who make up figures tend to distribute their digits fairly uniformly, a simple comparison of first-digit frequency distribution from the data with the expected distribution according to Benford's Law ought to show up any anomalous results. Following this idea, Mark Nigrini showed that Benford's Law could be used in forensic accounting and auditing as an indicator of accounting and expenses fraud. In practice, applications of Benford's Law for fraud detection routinely use more than the first digit.
Legal status
In the United States, evidence based on Benford's law has been admitted in criminal cases at the federal, state, and local levels.
Election data
Benford's Law has been invoked as evidence of fraud in the 2009 Iranian elections, and also used to analyze other election results. However, other experts consider Benford's Law essentially useless as a statistical indicator of election fraud in general.
Macroeconomic data
Similarly, the macroeconomic data the Greek government reported to the European Union before entering the eurozone was shown to be probably fraudulent using Benford's law, albeit years after the country joined.
Price digit analysis
Benford's law as a benchmark for the investigation of price digits has been successfully introduced into the context of pricing research. The importance of this benchmark for detecting irregularities in prices was first demonstrated in a European wide study which investigated consumer price digits before and after the euro introduction for price adjustments. The euro introduction in 2002, with its various exchange rates, distorted existing nominal price patterns while at the same time retaining real prices. While the first digits of nominal prices distributed according to Benford's Law, the study showed a clear deviation from this benchmark for the second and third digits in nominal market prices with a clear trend towards psychological pricing after the nominal shock of the euro introduction.
Genome data
The number of open reading frames and their relationship to genome size differs between eukaryotes and prokaryotes with the former showing a log-linear relationship and the latter a linear relationship. Benford's law has been used to test this observation with an excellent fit to the data in both cases.
Scientific fraud detection
A test of regression coefficients in published papers showed agreement with Benford's law. As a comparison group subjects were asked to fabricate statistical estimates. The fabricated results failed to obey Benford's law.
Statistical tests
Although the chi squared test has been used to test for compliance with Benford's law it has low statistical power when used with small samples.
The Kolmogorov–Smirnov test and the Kuiper test are more powerful when the sample size is small particularly when Stephens's corrective factor is used. These tests may be overly conservative when applied to discrete distribution. Values for the Benford test have been generated by Morrow. The critical values of the test statistics are shown below:
Two alternative tests specific to this law have been published: first, the max (m) statistic is given by
and secondly, the distance (d) statistic is given by
where FSD is the First Significant Digit and
Nigrini has suggested the use of a z statistic
with
where |x| is the absolute value of x, n is the sample size, 1/2n is a continuity correction factor, pe is the proportion expected from Benford's law and po is the observed proportion in the sample.
Morrow has also shown that for any random variable X (with a continuous pdf) divided by its standard deviation (σ), a value A can be found such that the probability of the distribution of the first significant digit of the random variable (X/σ)A will differ from Benford's Law by less than ε > 0. The value of A depends on the value of ε and the distribution of the random variable.
A method of accounting fraud detection based on bootstrapping and regression has been proposed.
If agreement with the Benford's law should be shown then the goodness-of-fit tests, which are mentioned above, are inappropriate. In this case the specific tests for equivalence should be applied. An empirical distribution is called equivalent to the Benford's law if a distance (for example total variation distance or the usual Euclidian distance) between the probability mass functions is sufficiently small. This method of testing with application to Benford's law is described in Ostrovski (2017).
Generalization to digits beyond the first
It is possible to extend the law to digits beyond the first. In particular, the probability of encountering a number starting with the string of digits n is given by:
(For example, the probability that a number starts with the digits 3, 1, 4 is log10(1 + 1/314) ≈ 0.0014.) This result can be used to find the probability that a particular digit occurs at a given position within a number. For instance, the probability that a "2" is encountered as the second digit is
And the probability that d (d = 0, 1, ..., 9) is encountered as the n-th (n > 1) digit is
The distribution of the n-th digit, as n increases, rapidly approaches a uniform distribution with 10% for each of the ten digits. Four digits is often enough to assume a uniform distribution of 10% as '0' appears 10.0176% of the time in the fourth digit while '9' appears 9.9824% of the time.
Tests with common distributions
Benford's law was empirically tested against the numbers (up to the 10th digit) generated by a number of important distributions, including the uniform distribution, the exponential distribution, the half-normal distribution, the right-truncated normal, the normal distribution, the chi square distribution and the log normal distribution. In addition to these the ratio distribution of two uniform distributions, the ratio distribution of two exponential distributions, the ratio distribution of two half-normal distributions, the ratio distribution of two right-truncated normal distributions, the ratio distribution of two chi-square distributions (the F distribution) and the log normal distribution were tested.
The uniform distribution as might be expected does not obey Benford's law. In contrast, the ratio distribution of two uniform distributions is well described by Benford's law. Benford's law also describes the exponential distribution and the ratio distribution of two exponential distributions well. Although the half-normal distribution does not obey Benford's law, the ratio distribution of two half-normal distributions does. Neither the right-truncated normal distribution nor the ratio distribution of two right-truncated normal distributions are well described by Benford's law. This is not surprising as this distribution is weighted towards larger numbers. Neither the normal distribution nor the ratio distribution of two normal distributions (the Cauchy distribution) obey Benford's law. The fit of chi square distribution depends on the degrees of freedom (df) with good agreement with df = 1 and decreasing agreement as the df increases. The F distribution is fitted well for low degrees of freedom. With increasing dfs the fit decreases but much more slowly than the chi square distribution. The fit of the log-normal distribution depends on the mean and the variance of the distribution. The variance has a much greater effect on the fit than does the mean. Larger values of both parameters result in better agreement with the law. The ratio of two log normal distributions is a log normal so this distribution was not examined.
Other distributions that have been examined include the Muth distribution, Gompertz distribution, Weibull distribution, gamma distribution, log-logistic distribution and the exponential power distribution all of which show reasonable agreement with the law. The Gumbel distribution – a density increases with increasing value of the random variable – does not show agreement with this law.
Distributions known to obey Benford's law
Some well-known infinite integer sequences provably satisfy Benford's Law exactly (in the asymptotic limit as more and more terms of the sequence are included). Among these are the Fibonacci numbers, the factorials, the powers of 2, and the powers of almost any other number.
Likewise, some continuous processes satisfy Benford's Law exactly (in the asymptotic limit as the process continues through time). One is an exponential growth or decay process: If a quantity is exponentially increasing or decreasing in time, then the percentage of time that it has each first digit satisfies Benford's Law asymptotically (i.e. increasing accuracy as the process continues through time).
Distributions known to not obey Benford's law
Square roots and reciprocals do not obey this law. Also, Benford's law does not apply to unary systems such as tally marks. Telephone directories violate Benford's law because the numbers have a mostly fixed length and do not have the initial digit 1. Benford's law is violated by the populations of all places with population at least 2500 from five US states according to the 1960 and 1970 censuses, where only 19% began with digit 1 but 20% began with digit 2, for the simple reason that the truncation at 2500 introduces statistical bias. The terminal digits in pathology reports violate Benford's law due to rounding, and the fact that terminal digits are never expected to follow Benford's law in the first place.
Criteria for distributions expected and not expected to obey Benford's Law
A number of criteria—applicable particularly to accounting data—have been suggested where Benford's Law can be expected to apply and not to apply.
Distributions that can be expected to obey Benford's Law
Distributions that would not be expected to obey Benford's Law
Moments
Moments of random variables for the digits 1 to 9 following this law have been calculated:
For the first and second digit distribution these values are also known:
A table of the exact probabilities for the joint occurrence of the first two digits according to Benford's law is available, as is the population correlation between the first and second digits: ρ = 0.0561.