Harman Patil (Editor)

Timeline of the 2011 Atlantic hurricane season

Updated on
Edit
Like
Comment
Share on FacebookTweet on TwitterShare on LinkedInShare on Reddit
Timeline of the 2011 Atlantic hurricane season

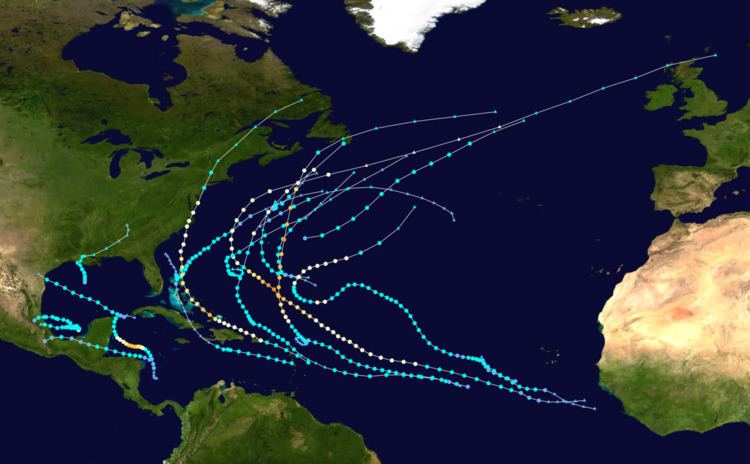
The 2011 Atlantic hurricane season was well above average in the number of tropical cyclones that formed, at nineteen. It was also the first time that the first eight tropical cyclones of the season failed to attain hurricane status. Although Tropical Storm Arlene formed on June 28, the season officially began on June 1 and ended on November 30, dates that conventionally delimit the period of each year when most tropical cyclones develop in the Atlantic basin. The season's final storm, Tropical Storm Sean, dissipated on November 11.

Contents

The season produced twenty tropical depressions, of which nineteen further intensified into tropical storms; seven strengthened hurricanes, and four hurricanes ultimately intensified into major hurricanes. This makes 2011 the third most active hurricane season on record, along with 1887, 1995, and 2010. The two most significant storms, in terms of loss of life and damage, were Hurricane Irene and Tropical Storm Lee. Hurricane Irene was a powerful and unusually large storm that made several landfalls along the East Coast of the United States after peaking with maximum sustained winds of 120 mph (195 km/h). Tropical Storm Lee was a disorganized tropical cyclone that moved ashore the coastline of Louisiana before producing historic flooding in the Northeast United States as an extratropical cyclone.

This timeline includes information that was not operationally released, meaning that data from post-storm reviews by the National Hurricane Center, such as a storm that was not operationally warned upon, has been included. This timeline documents tropical cyclone formations, strengthening, weakening, landfalls, extratropical transitions, and dissipations during the season.

June

June 1
  • The 2011 Atlantic hurricane season officially begins.
  • June 28
  • 1800 UTC (1:00 p.m. CDT) – Tropical Storm Arlene develops from an area of low pressure roughly 260 mi (420 km) east-southeast of Tampico, Mexico.
  • June 30
  • 1200 UTC (7:00 a.m. CDT) – Tropical Storm Arlene reaches its peak intensity with winds of 65 mph (100 km/h) and a minimum barometric pressure of 993 mbar (hPa; 29.32 inHg).
  • 1300 UTC (8:00 a.m. CDT) – Tropical Storm Arlene makes landfall near Cabo Rojo, Veracruz, with winds of 65 mph (100 km/h).
  • July

    July 1
  • 0000 UTC (7:00 p.m. CDT June 30) – Tropical Storm Arlene weakens to a tropical depression.
  • 0600 UTC (1:00 a.m. CDT) – Tropical Depression Arlene dissipates over the high terrain of Mexico.
  • July 17
  • 1800 UTC (2:00 p.m. EDT) – Tropical Depression Two develops from an area of low pressure roughly 70 mi (110 km) north of Grand Bahama Island.
  • July 18
  • 0000 UTC (8:00 p.m. EDT July 17) – Tropical Depression Two intensifies into Tropical Storm Bret.
  • 1800 UTC (2:00 p.m. EDT) – Tropical Storm Bret reaches its peak intensity with winds of 70 mph (110 km/h) and a minimum pressure of 995 mbar (hPa; 29.38 inHg).
  • July 20
  • 0600 UTC (2:00 a.m. AST) – Tropical Depression Three develops from an area of low pressure roughly 305 mi (490 km) east of Bermuda.
  • 1200 UTC (8:00 a.m. AST) - Tropical Depression Three intensifies into Tropical Storm Cindy.
  • July 21
  • 1800 UTC (2:00 p.m. AST) – Tropical Storm Cindy reaches its peak intensity with winds of 70 mph (110 km/h) and a minimum barometric pressure of 994 mbar (hPa; 29.35 inHg).
  • July 22
  • 0000 UTC (8:00 p.m. AST July 21) – Tropical Storm Bret weakens to a tropical depression northwest of Bermuda.
  • 1200 UTC (8:00 a.m. AST) – Tropical Depression Bret degenerates into a non-convective remnant area of low pressure roughly 490 mi (790 km) south-southwest of Cape Race, Newfoundland.
  • July 23
  • 0000 UTC (8:00 p.m. AST July 22) – Tropical Storm Cindy degenerates into a non-convective remnant low roughly 855 mi (1340 km) southwest of the coast of southwestern Ireland.
  • July 27
  • 0600 UTC (1:00 a.m. CDT) – Tropical Depression Four develops from an area of low pressure roughly 50 mi (85 km) northeast of Cancún, Mexico.
  • 1800 UTC (1:00 p.m. CDT) – Tropical Depression Four intensifies into Tropical Storm Don roughly 55 mi (90 km) north-northeast of Cancun, Mexico.
  • July 29
  • 0000 UTC (7:00 p.m. CDT July 28) – Tropical Storm Don reaches its peak intensity with winds of 50 mph (85 km/h) and a minimum pressure of 997 mbar (hPa; 29.44 inHg) roughly 345 mi (555 km) east-southeast of Corpus Christi, Texas.
  • July 30
  • 0230 UTC (9:30 p.m. CDT July 29) – Tropical Storm Don weakens to a tropical depression with winds of 35 mph (55 km/h) as it makes landfall along the Padre Island National Seashore just northeast of Baffin Bay, Texas.
  • 0600 UTC (1:00 a.m. CDT) – Tropical Depression Don degenerates into a remnant low over southeast Texas.
  • August

    August 2
  • 0000 UTC (8:00 p.m. AST August 1) – Tropical Storm Emily develops from an area of low pressure roughly 30 mi (55 km) northwest of Martinique.
  • August 3
  • 0600 UTC (2:00 a.m. AST) – Tropical Storm Emily reaches its peak intensity with winds of 50 mph (85 km) and a minimum barometric pressure of 1003 mbar (hPa; 29.62 inHg).
  • August 4
  • 1800 UTC (2:00 p.m. EDT) – Tropical Storm Emily degenerates into an open tropical wave south of Haiti.
  • August 6
  • 1800 UTC (2:00 p.m. EDT) – The remnants of Tropical Storm Emily regenerate into Tropical Depression Emily.
  • August 7
  • 0000 UTC (8:00 p.m. EDT August 6) – Tropical Depression Emily regains tropical storm status north of Grand Bahama.
  • 1200 UTC (8:00 a.m. EDT) – Tropical Storm Emily degenerates into a non-convective remnant area of low pressure.
  • August 12
  • 1800 UTC (2:00 p.m. AST) – Tropical Depression Six develops from an area of low pressure roughly 200 mi (320 km) north of Bermuda.
  • August 13
  • 0600 UTC (2:00 a.m. AST) – Tropical Depression Six intensifies into Tropical Storm Franklin roughly 450 mi (725 km) south-southeast of Halifax, Nova Scotia.
  • 1200 UTC (8:00 a.m. AST) – Tropical Storm Franklin reaches its peak intensity with maximum sustained winds of 45 mph (75 km/h) and a minimum barometric pressure of 1004 mbar (hPa; 29.65 inHg).
  • 1800 UTC (2:00 p.m. AST) – Tropical Depression Seven develops from an area of low pressure roughly 370 mi (595 km) southeast of Bermuda.
  • 1800 UTC (2:00 p.m. AST) – Tropical Storm Franklin transitions into an extratropical cyclone.
  • August 14
  • 0600 UTC (2:00 a.m. AST) – Tropical Depression Seven intensifies into Tropical Storm Gert.
  • August 15
  • 1200 UTC (8:00 a.m. AST) – Tropical Storm Gert reaches its peak intensity with winds of 65 mph (100 km/h) and a minimum barometric pressure of 1000 mbar (hPa; 29.53 inHg).
  • August 16
  • 1200 UTC (8:00 a.m. AST) – Tropical Storm Gert degenerates into a non-convective remnant area of low pressure.
  • August 19
  • 0000 UTC (8:00 p.m. EDT August 18) – Tropical Depression Eight develops from an area of low pressure roughly 70 mi (110 km) northeast of Cabo Gracias a Dios on the border of Nicaragua and Honduras.
  • 1200 UTC (8:00 a.m. EDT) – Tropical Depression Eight intensifies into Tropical Storm Harvey.
  • August 20
  • 0600 UTC (2:00 a.m. EDT) – Tropical Storm Harvey reaches its peak intensity with a minimum barometric pressure of 994 mbar (hPa; 29.35 inHg).
  • 1730 UTC (12:30 p.m. CDT) – Tropical Storm Harvey reaches its peak intensity with winds of 65 mph (100 km/h) and simultaneously makes its first landfall near Dangriga, Belize.
  • August 21
  • 0000 UTC (8:00 p.m. AST August 20) – Tropical Storm Irene develops from an area of low pressure roughly 120 mi (195 km) east of Martinique.
  • 0600 UTC (1:00 a.m. CDT) – Tropical Storm Harvey weakens to a tropical depression.
  • 2300 UTC (7:00 p.m. AST August 20) – Tropical Storm Irene makes its first landfall on Saint Croix with winds of 70 mph (110 km/h).
  • August 22
  • 0000 UTC (7:00 p.m. CDT August 21) – Tropical Depression Harvey regains tropical storm status in the Bay of Campeche.
  • 0200 UTC (9:00 p.m. CDT August 21) – Tropical Storm Harvey makes its second and final landfall near Punta Roca Partida, Mexico, with winds of 40 mph (65 km/h).
  • 0525 UTC (1:25 a.m. AST) – Tropical Storm Irene makes its second landfall near Punta Santiago, Puerto Rico, with winds of 70 mph (110 km/h).
  • 0600 UTC (1:00 a.m. CDT) – Tropical Storm Harvey weakens to a tropical depression.
  • 0600 UTC (2:00 a.m. AST) – Tropical Storm Irene intensifies into a Category 1 hurricane on the Saffir–Simpson Hurricane Scale, becoming the first hurricane of the 2011 season.
  • 1800 UTC (1:00 p.m. CDT) – Tropical Depression Harvey dissipates roughly 85 mi (140 km) southwest of Veracruz, Mexico.
  • August 24
  • 0600 UTC (2:00 a.m. AST) – Hurricane Irene intensifies into a Category 2 hurricane north of Haiti.
  • 1200 UTC (8:00 a.m. EDT) – Hurricane Irene intensifies into a Category 3 hurricane, the first major hurricane of the 2011 season, and simultaneously reaches its peak intensity with winds of 120 mph (195 km/h).
  • 1600 UTC (12:00 p.m. EDT) – Hurricane Irene makes its third landfall on the Acklins and Crooked Islands, with winds of 115 mph (185 km/h).
  • August 25
  • 0000 UTC (8:00 p.m. EDT August 24) – Hurricane Irene weakens to a Category 2 hurricane and simultaneously makes its fourth landfall on Long Island, Bahamas, with winds of 105 mph (165 km/h).
  • 0000 UTC (8:00 p.m. AST August 24) – Tropical Depression Ten develops from an area of low pressure roughly 350 mi (565 km) west-southwest of the Cape Verde Islands and simultaneously reaches its peak intensity with winds of 35 mph (55 km/h) and a minimum barometric pressure of 1006 mbar (hPa; 29.71 inHg).
  • 0900 UTC (5:00 a.m. EDT) – Hurricane Irene makes its fifth landfall on Eleuthera, with winds of 100 mph (160 km/h).
  • 1800 UTC (2:00 p.m. AST) – Hurricane Irene makes its sixth landfall on the Abaco Islands, with winds of 105 mph (165 km/h).
  • August 26
  • 0600 UTC (2:00 a.m. EDT) – Hurricane Irene reaches its peak intensity with a minimum barometric pressure of 942 mbar (hPa; 27.82 inHg).
  • 1800 UTC (2:00 p.m. EDT) – Hurricane Irene weakens to a Category 1 hurricane.
  • August 27
  • 0000 UTC (8:00 p.m. AST August 26) – Tropical Depression Ten degenerates into a non-convective remnant area of low pressure.
  • 0600 UTC (2:00 a.m. AST) – Tropical Depression Eleven develops from an area of low pressure roughly 305 mi (490 km) south-southeast of Bermuda.
  • 1200 UTC (8:00 a.m. EDT) – Hurricane Irene makes its seventh landfall near Cape Lookout, North Carolina, with winds of 85 mph (140 km/h).
  • 1200 UTC (8:00 a.m. AST) – Tropical Depression Eleven intensifies into Tropical Storm Jose.
  • August 28
  • 0935 UTC (5:35 a.m. EDT) – Hurricane Irene weakens to a tropical storm and simultaneously makes its eighth landfall on Brigantine Island, New Jersey, with winds of 70 mph (110 km/h).
  • 1200 UTC (8:00 a.m. AST) – Tropical Storm Jose reaches its peak intensity with winds of 45 mph (75 km/h) and a minimum barometric pressure of 1006 mbar (hPa; 29.71 inHg).
  • 1300 UTC (9:00 a.m. EDT) – Tropical Storm Irene makes its ninth and final landfall in Coney Island, Brooklyn, with winds of 65 mph (100 km/h).
  • August 29
  • 0000 UTC (8:00 p.m. EDT August 28) – Tropical Storm Irene transitions into an extratropical cyclone near the Vermont–New Hampshire border.
  • 0000 UTC (8:00 p.m. EDT August 28) – Tropical Storm Jose degenerates into a non-convective remnant area of low pressure roughly 120 mi (195 km) north-northwest of Bermuda.
  • 0600 UTC (2:00 a.m. AST) – Tropical Depression Twelve develops from an area of low pressure roughly 375 mi (605 km) southwest of the Cape Verde Islands.
  • August 30
  • 0000 UTC (8:00 p.m AST August 29) – Tropical Depression Twelve intensifies into Tropical Storm Katia roughly 425 mi (685 km) southwest of the Cape Verde Islands.
  • September

    September 1
  • 0000 UTC (8:00 p.m. EDT August 31) – A tropical depression develops from an area of low pressure roughly 290 mi (465 km) north of Bermuda.
  • 0000 UTC (8:00 p.m. AST August 31) – Tropical Storm Katia intensifies into a Category 1 hurricane roughly 1175 mi (1890 km) east of the Leeward Islands.
  • 1200 UTC (8:00 a.m. EDT) – The tropical depression intensifies into an unnamed tropical storm.
  • September 2
  • 0000 UTC (7:00 p.m. CDT September 1) – Tropical Depression Thirteen develops from an area of low pressure roughly 190 mi (305 km) southwest of the mouth of the Mississippi River.
  • 0600 UTC (2:00 a.m. EDT) – The unnamed tropical storm reaches its peak intensity with winds of 45 mph (75 km/h) and a minimum pressure of 1002 mbar (hPa; 29.59 inHg).
  • 1200 UTC (7:00 a.m. CDT) – Tropical Depression Thirteen intensifies into Tropical Storm Lee.
  • September 3
  • 0000 UTC (8:00 p.m. EDT September 2) – The unnamed tropical storm transitions into an extratropical cyclone roughly 310 mi (500 km) south-southeast of Halifax, Nova Scotia.
  • 1200 UTC (7:00 a.m. CDT) – Tropical Storm Lee reaches its peak intensity with winds of 60 mph (95 km/h) and simultaneously transitions into a subtropical cyclone.
  • September 4
  • 0600 UTC (1:00 a.m. CDT) – Subtropical Storm Lee reaches its peak intensity with a minimum barometric pressure of 986 mbar (hPa; 29.12 inHg).
  • 1030 UTC (5:30 a.m. CDT) – Subtropical Storm Lee makes landfall near Intracoastal City, Louisiana, with winds of 45 mph (75 km/h).
  • 1200 UTC (8:00 a.m. AST) – Hurricane Katia intensifies into a Category 2 hurricane.
  • September 5
  • 0600 UTC (1:00 a.m. CDT) – Subtropical Storm Lee transitions into an extratropical cyclone over east-central Louisiana.
  • 1200 UTC (8:00 a.m. AST) – Hurricane Katia intensifies into a Category 3 hurricane.
  • September 6
  • 0000 UTC (8:00 p.m. AST September 5) – Hurricane Katia intensifies into a Category 4 hurricane and simultaneously reaches its peak intensity with winds of 140 mph (220 km/h) and a minimum barometric pressure of 942 mbar (hPa; 27.82 inHg).
  • 1200 UTC (8:00 a.m. AST) – Hurricane Katia weakens to a Category 3 hurricane.
  • 1800 UTC (2:00 p.m. AST) – Hurricane Katia weakens to a Category 2 hurricane.
  • 1800 UTC (2:00 p.m. AST) – Tropical Depression Fourteen develops from an area of low pressure roughly 700 mi (1125 km) west-southwest of the Cape Verde Islands.
  • September 7
  • 0000 UTC (8:00 p.m. AST September 6) – Tropical Depression Fourteen intensifies into Tropical Storm Maria.
  • 1200 UTC (8:00 a.m. AST) – Hurricane Katia weakens to a Category 1 hurricane.
  • 1800 UTC (1:00 p.m. CDT) – Tropical Storm Nate develops from an area of low pressure roughly 140 mi (220 km) north of Villahermosa, Mexico.
  • September 8
  • 1800 UTC (1:00 p.m. CDT) – Tropical Storm Nate intensifies into a Category 1 hurricane roughly 70 mi (110 km) north-northwest of Ciudad del Carmen.
  • September 9
  • 0000 UTC (7:00 p.m. CDT September 8) – Hurricane Nate reaches its peak intensity with winds of 75 mph (120 km/h) and a minimum pressure of 994 mbar (hPa; 29.35 inHg).
  • 0600 UTC (1:00 a.m. CDT) – Hurricane Nate weakens to a tropical storm.
  • 1200 UTC (8:00 a.m. AST) – Tropical Storm Maria degenerates into a tropical disturbance.
  • September 10
  • 1200 UTC (8:00 a.m. AST) – The remnants of Tropical Storm Maria regenerate into a tropical storm roughly 40 mi (65 km) east-southeast of Antigua.
  • 1200 UTC (8:00 a.m. AST) – Hurricane Katia transitions into an extratropical cyclone roughly 250 mi (400 km) south-southeast of Cape Race, Newfoundland.
  • September 11
  • 1600 UTC (11:00 a.m. CDT) – Tropical Storm Nate makes landfall near Tecolutla, Veracruz, with winds of 45 mph (75 km/h).
  • September 12
  • 0000 UTC (1:00 a.m. CDT) – Tropical Storm Nate degenerates into a non-convective remnant area of low pressure roughly 20 mi (30 km) west of Poza Rica, Mexico.
  • September 15
  • 1800 UTC (2:00 p.m. EDT) – Tropical Storm Maria intensifies into a Category 1 hurricane.
  • September 16
  • 0600 UTC (2:00 a.m. EDT) – Hurricane Maria reaches its peak intensity with winds of 80 mph (130 km/h) and a minimum barometric pressure of 983 mbar (hPa; 29.03 inHg).
  • 1800 UTC (2:00 p.m. AST) – Hurricane Maria weakens to a tropical storm.
  • 1830 UTC (2:30 p.m. AST) – Tropical Storm Maria makes landfall near Cape St. Mary's, Newfoundland, with winds of 70 mph (110 km/h)
  • 2100 UTC (5:00 p.m. AST) – Tropical Storm Maria dissipates over Newfoundland.
  • September 20
  • 1800 UTC (2:00 p.m. AST) – Tropical Depression Sixteen develops from an area of low pressure roughly 1300 mi (2090 km) east of the Lesser Antilles.
  • September 21
  • 0000 UTC (8:00 p.m. AST September 20) – Tropical Depression Sixteen intensifies into Tropical Storm Ophelia.
  • September 24
  • 0600 UTC (2:00 a.m. AST) – Tropical Depression Seventeen develops from an area of low pressure roughly 225 mi (360 km) south of the Cape Verde Islands.
  • 1200 UTC (8:00 a.m. AST) – Tropical Depression Seventeen intensifies into Tropical Storm Philippe.
  • September 25
  • 1200 UTC (8:00 a.m. AST) – Tropical Storm Ophelia degenerates into a remnant area of low pressure roughly 180 mi (350 km) east of the Leeward Islands.
  • September 27
  • 1200 UTC (8:00 a.m. AST) – The remnants of Tropical Storm Ophelia regenerate into a tropical depression roughly 170 mi (275 km) east of the Leeward Islands.
  • September 28
  • 0000 UTC (8:00 p.m. AST September 27) – Tropical Storm Philippe weakens to a tropical depression roughly 675 mi (1085 km) west of the Cape Verde Islands.
  • 0600 UTC (2:00 a.m. AST) – Tropical Depression Ophelia re-intensifies into a tropical storm roughly 130 mi (210 km) east of the Leeward Islands.
  • 1200 UTC (8:00 a.m. AST) – Tropical Depression Philippe re-intensifies into a tropical storm.
  • September 29
  • 1800 UTC (2:00 p.m. AST) – Tropical Storm Ophelia intensifies into a Category 1 hurricane roughly 200 mi (320 km) north of the Leeward Islands.
  • September 30
  • 0600 UTC (2:00 a.m. AST) – Hurricane Ophelia intensifies into a Category 2 hurricane.
  • 1800 UTC (2:00 p.m. AST) – Hurricane Ophelia intensifies into a Category 3 hurricane roughly midway between the Leeward Islands and Bermuda.
  • October

    October 2
  • 0000 UTC (8:00 p.m. AST October 1) – Hurricane Ophelia intensifies into a Category 4 hurricane and simultaneously reaches its peak intensity with winds of 140 mph (220 km/h) and a minimum barometric pressure of 940 mbar (hPa; 27.76 inHg).
  • 0600 UTC (2:00 a.m. AST) – Hurricane Ophelia weakens to a Category 3 hurricane.
  • 1200 UTC (8:00 a.m. AST) – Hurricane Ophelia weakens to a Category 2 hurricane.
  • October 3
  • 0000 UTC (8:00 p.m. AST October 2) – Hurricane Ophelia weakens to a Category 1 hurricane.
  • 0600 UTC (2:00 a.m. AST) – Hurricane Ophelia weakens to a tropical storm roughly 200 mi (320 km) west-southwest of Cape Race, Newfoundland.
  • 1000 UTC (6:00 a.m. AST) – Tropical Storm Ophelia transitions into an extratropical cyclone south of Newfoundland.
  • October 4
  • 0000 UTC (8:00 p.m. AST October 3) – Tropical Storm Philippe intensifies into a Category 1 hurricane roughly 475 mi (765 km) northeast of the Leeward Islands.
  • 1200 UTC (8:00 a.m. AST) – Hurricane Philippe weakens to a tropical storm.
  • October 6
  • 0600 UTC (2:00 a.m. AST) – Tropical Storm Philippe re-intensifies into a Category 1 hurricane roughly 400 mi (645 km) south-southeast of Bermuda.
  • October 7
  • 0000 UTC (8:00 p.m. AST October 6) – Hurricane Philippe reaches its peak intensity with winds of 90 mph (150 km/h) and a minimum barometric pressure of 976 mbar (hPa; 28.82 inHg).
  • October 8
  • 0600 UTC (2:00 a.m. AST) – Hurricane Philippe weakens to a tropical storm.
  • 1800 UTC (2:00 p.m. AST) – Tropical Storm Philippe transitions into an extratropical cyclone.
  • October 23
  • 0600 UTC (2:00 a.m. EDT) – Tropical Depression Eighteen develops from an area of low pressure roughly 55 mi (90 km) north of Providencia Island.
  • October 24
  • 0000 UTC (8:00 a.m. EDT) – Tropical Depression Eighteen intensifies into Tropical Storm Rina.
  • 1800 UTC (2:00 p.m. EDT) – Tropical Storm Rina intensifies into a Category 1 hurricane.
  • October 25
  • 0600 UTC (2:00 a.m. EDT) – Hurricane Rina intensifies into a Category 2 hurricane.
  • 1800 UTC (2:00 p.m. EDT) – Hurricane Rina intensifies into a Category 3 hurricane.
  • October 26
  • 0000 UTC (7:00 p.m. CDT October 25) – Hurricane Rina reaches its peak intensity with winds of 115 mph (185 km/h) and a minimum barometric pressure of 966 mbar (hPa; 28.53 inHg).
  • 1200 UTC (7:00 a.m. CDT) – Hurricane Rina weakens to a Category 2 hurricane.
  • 1800 UTC (1:00 p.m. CDT) – Hurricane Rina weakens to a Category 1 hurricane.
  • October 27
  • 1200 UTC (7:00 a.m. CDT) – Hurricane Rina weakens to a tropical storm roughly 75 mi (120 km) south-southeast of Tulum, Mexico.
  • October 28
  • 0200 UTC (9:00 p.m. CDT) – Tropical Storm Rina makes landfall near Paamul, Mexico, with winds of 60 mph (95 km/h).
  • 1800 UTC (1:00 p.m. CDT) – Tropical Storm Rina degenerates into a non-convective remnant area of low pressure south of Cuba.
  • November

    November 8
  • 0600 UTC (1:00 a.m. EST) – Subtropical Storm Sean develops from an area of low pressure roughly 445 mi (720 km) southwest of Bermuda.
  • 1800 UTC (1:00 p.m. AST) – Subtropical Storm Sean transitions into a fully tropical storm.
  • November 12
  • 0000 UTC (7:00 p.m. AST November 11) – Tropical Storm Sean transitions into an extratropical cyclone southeast of Newfoundland.
  • November 30
  • The 2011 Atlantic hurricane season officially ends.
  • References

    Timeline of the 2011 Atlantic hurricane season Wikipedia