Girish Mahajan (Editor)

Timeline of the 2010 Atlantic hurricane season

Updated on
Edit
Like
Comment
Share on FacebookTweet on TwitterShare on LinkedInShare on Reddit
Timeline of the 2010 Atlantic hurricane season

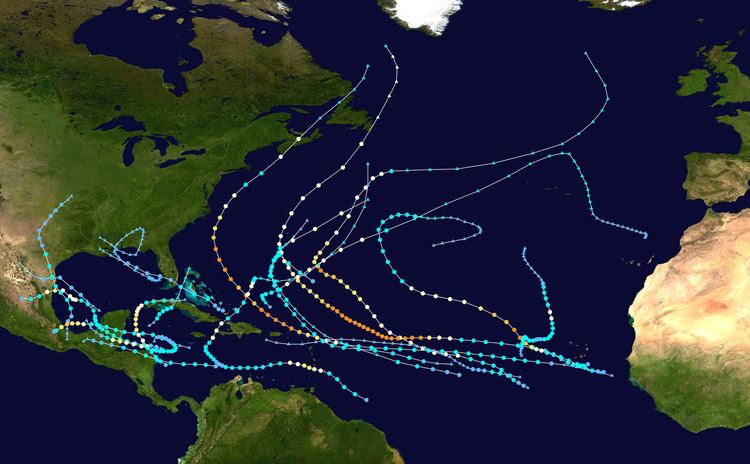
The 2010 Atlantic hurricane season was one of the most active Atlantic hurricane seasons since records began in 1851 in which nineteen named storms formed. The season officially began on June 1 (with Hurricane Alex, the first hurricane of the season forming on June 15) and ended on November 30, dates that conventionally delimit the period of each year when most tropical cyclones develop in the Atlantic basin. The season's final storm, Hurricane Tomas, dissipated on November 7.

Contents

The season produced twenty-one tropical cyclones, of which nineteen strengthened into tropical storms; twelve became hurricanes, and five further intensified into major hurricanes. The two most significant storms of the season, in terms of damage and loss of life, were hurricanes Igor and Tomas. Igor was one of the largest storms by gale diameter on record, and one that attained maximum sustained winds of 155 mph (250 km/h) before striking Newfoundland as a much weaker storm several days later. Tomas was a late-season tropical cyclone that rapidly intensified to reach maximum sustained winds of 100 mph (160 km/h) as it entered the eastern Caribbean Sea. Though the system did not make landfall, it severely affected the Greater Antilles, and impacted the southeastern Bahamas as a tropical storm before quickly moving into the open Atlantic.

This timeline documents tropical cyclone formations, strengthening, weakening, landfalls, extratropical transitions, and dissipations during the season. It includes information that was not released in situ, meaning that data from post-storm reviews by the National Hurricane Center, such as a storm that was not initially warned upon, has been included.

June

June 1

  • The 2010 Atlantic hurricane season officially begins.
  • June 25

  • 18:00 UTC (2:00 p.m. EDT) – Tropical Depression One develops from an area of low pressure roughly 80 mi (130 km) north-northeast of Puerto Lempira.
  • June 26

  • 06:00 UTC (2:00 a.m. EDT) – Tropical Depression One intensifies into Tropical Storm Alex.
  • June 27

  • 00:00 UTC (7:00 p.m. CDT, June 26) – Tropical Storm Alex makes its first landfall near Belize City with winds of 65 mph (100 km/h).
  • June 30

  • 00:00 UTC (7:00 p.m. CDT, June 29) – Tropical Storm Alex intensifies into a Category 1 hurricane on the Saffir–Simpson hurricane wind scale, becoming the first of the 2010 season.
  • July

    July 1

  • 00:00 UTC (7:00 p.m. CDT June 30) – Hurricane Alex intensifies into a Category 2 hurricane.
  • 02:00 UTC (9:00 p.m. CDT June 30) – Hurricane Alex attains its peak intensity with maximum sustained winds of 110 mph (175 km/h) and a minimum barometric pressure of 946 mb (hPa; 27.94 inHg), and simultaneously makes a second and final landfall near Soto la Marina.
  • 06:00 UTC (1:00 a.m. CDT) – Hurricane Alex weakens to a Category 1 hurricane.
  • 12:00 UTC (7:00 a.m. CDT) – Hurricane Alex weakens to a tropical storm.
  • July 2

  • 00:00 UTC (7:00 p.m. CDT, July 1) – Tropical Storm Alex weakens to a tropical depression.
  • 06:00 UTC (1:00 a.m. CDT) – Tropical Depression Alex dissipates over the high terrain of central Mexico.
  • July 8

  • 00:00 UTC (7:00 p.m. CDT, July 7) – Tropical Depression Two develops from an area of low pressure roughly 250 mi (400 km) southeast of Brownsville, Texas, and simultaneously attains its peak intensity with maximum sustained winds of 35 mph (55 km/h) and a minimum barometric pressure of 1005 mb (hPa; 29.68 inHg).
  • 14:00 UTC (9:00 a.m. CDT) – Tropical Depression Two makes landfall on South Padre Island, Texas, with winds of 35 mph (55 km/h).
  • July 9

  • 06:00 UTC (1:00 a.m. CDT) – Tropical Depression Two degenerates into a non-convective remnant area of low pressure over northern Mexico.
  • July 22

  • 06:00 UTC (2:00 a.m. EDT) – Tropical Depression Three develops from an area of low pressure south of Acklins Island.
  • 23:15 UTC (7:15 p.m. EDT) – Tropical Depression Three intensifies into Tropical Storm Bonnie and simultaneously makes its first landfall on Ragged Island, Bahamas, with winds of 40 mph (65 km/h).
  • July 23

  • 05:15 UTC (1:15 a.m. EDT) – Tropical Storm Bonnie makes its second landfall on Andros Island with winds of 45 mph (75 km/h).
  • 06:00 UTC (2:00 a.m. EDT) – Tropical Storm Bonnie attains its peak intensity with a minimum barometric pressure of 1005 mb (29.68 inHg).
  • 14:30 UTC (10:30 a.m. EDT) – Tropical Storm Bonnie makes its third and final landfall near Elliott Key with winds of 40 mph (65 km/h).
  • 18:00 UTC (2:00 p.m. EDT) – Tropical Storm Bonnie weakens to a tropical depression.
  • July 25

  • 00:00 UTC (7:00 p.m. CDT, July 24) – Tropical Depression Bonnie degenerates into a non-convective remnant area of low pressure roughly 60 mi (95 km) southeast of the mouth of the Mississippi River.
  • August

    August 2

  • 12:00 UTC (8:00 a.m. AST) – Tropical Depression Four develops from an area of low pressure in the central Atlantic.
  • August 3

  • 06:00 UTC (2:00 a.m. AST) – Tropical Depression Four intensifies into Tropical Storm Colin roughly 840 mi (1350 km) east of the Lesser Antilles.
  • 18:00 UTC (2:00 p.m. AST) – Tropical Storm Colin degenerates into a trough of low pressure.
  • August 5

  • 12:00 UTC (8:00 a.m. AST) – The remnants of Tropical Storm Colin regenerate into a tropical storm roughly 280 mi (450 km) north-northeast of San Juan, Puerto Rico.
  • 21:00 UTC (5:00 p.m. AST) – Tropical Storm Colin attains its peak intensity with maximum sustained winds of 60 mph (95 km/h) and a minimum barometric pressure of 1005 mb (hPa; 29.68 inHg).
  • August 8

  • 00:00 UTC (8:00 p.m. AST, August 7) – Tropical Storm Colin weakens to a tropical depression roughly 170 mi (275 km) south-southwest of Bermuda.
  • 12:00 UTC (8:00 a.m. AST) – Tropical Depression Colin dissipates roughly 100 mi (160 km) southwest of Bermuda.
  • August 10

  • 18:00 UTC (1:00 p.m. CDT) – Tropical Depression Five develops from an area of low pressure roughly 105 mi (165 km) west of Naples, Florida.
  • August 11

  • 00:00 UTC (7:00 p.m. CDT, August 10) – Tropical Depression Five attains its peak intensity with maximum sustained winds of 35 mph (55 km/h) and a minimum barometric pressure of 1007 mb (hPa; 29.74 inHg).
  • 06:00 UTC (2:00 a.m. CDT) – Tropical Depression Five degenerates into a remnant area of low pressure roughly 125 mi (200 km) west of Naples, Florida.
  • August 21

  • 18:00 UTC (2:00 p.m. AST) – Tropical Depression Six develops from an area of low pressure roughly 450 mi (720 km) west-southwest of the Cape Verde Islands.
  • August 22

  • 06:00 UTC (2:00 a.m. AST) – Tropical Depression Six intensifies into Tropical Storm Danielle.
  • August 23

  • 18:00 UTC (2:00 p.m. AST) – Tropical Storm Danielle intensifies into a Category 1 hurricane roughly 960 mi (1545 km) west of the southernmost Cape Verde Islands.
  • August 25

  • 06:00 UTC (2:00 a.m. AST) – Tropical Depression Seven develops from an area of low pressure roughly 200 mi (320 km) west-southwest of the Cape Verde Islands.
  • 12:00 UTC (8:00 a.m. AST) – Tropical Depression Seven intensifies into Tropical Storm Earl.
  • August 26

  • 06:00 UTC (2:00 a.m. AST) – Hurricane Danielle intensifies into a Category 2 hurricane.
  • August 27

  • 06:00 UTC (2:00 a.m. AST) – Hurricane Danielle intensifies into a Category 3 hurricane, the first major hurricane of the season.
  • 18:00 UTC (2:00 p.m. AST) – Hurricane Danielle intensifies into a Category 4 hurricane and simultaneously attains its peak intensity with maximum sustained winds of 135 mph (215 km/h) and a minimum barometric pressure of 942 mb (hPa; 27.82 inHg).
  • August 28

  • 00:00 UTC (8:00 p.m. AST, August 27) – Hurricane Danielle weakens to a Category 3 hurricane.
  • 06:00 UTC (2:00 a.m. AST) – Hurricane Danielle weakens to a Category 2 hurricane.
  • August 29

  • 06:00 UTC (2:00 a.m. AST) – Hurricane Danielle weakens to a Category 1 hurricane.
  • 12:00 UTC (8:00 a.m. AST) – Tropical Storm Earl intensifies into a Category 1 hurricane roughly 220 mi (355 km) east of the northern Leeward Islands.
  • August 30

  • 00:00 UTC (8:00 p.m. AST, August 29) – Hurricane Earl intensifies into a Category 2 hurricane.
  • 12:00 UTC (8:00 a.m. EDT) – Hurricane Earl intensifies into a Category 3 hurricane.
  • 12:00 UTC (8:00 a.m. AST) – A tropical depression develops from an area of low pressure roughly 900 mi (1450 km) east of the Lesser Antilles.
  • 18:00 UTC (2:00 p.m. AST) – Hurricane Danielle weakens to a tropical storm.
  • 18:00 UTC (2:00 p.m. EDT) – Hurricane Earl intensifies into a Category 4 hurricane.
  • 18:00 UTC (2:00 p.m. AST) – The tropical depression intensifies into Tropical Storm Fiona.
  • August 31

  • 00:00 UTC (8:00 p.m. AST, August 30) – Tropical Storm Danielle degenerates into a remnant area of low pressure well northeast of the Azores.
  • September

    September 1

  • 00:00 UTC (8:00 p.m. EDT, August 31) – Hurricane Earl weakens to a Category 3 hurricane.
  • 06:00 UTC (2:00 a.m. AST) – Tropical Depression Nine develops from an area of low pressure roughly 800 mi (1290 km) west-southwest of the Cape Verde Islands.
  • 12:00 UTC (8:00 a.m. AST) – Tropical Storm Fiona attains its peak intensity with a minimum barometric pressure of 998 mb (hPa; 29.47 inHg).
  • 12:00 UTC (8:00 a.m. AST) – Tropical Depression Nine intensifies into Tropical Storm Gaston.
  • 18:00 UTC (2:00 p.m. EDT) – Hurricane Earl re-intensifies into a Category 4 hurricane.
  • 18:00 UTC (2:00 p.m. AST) – Tropical Storm Fiona attains peak maximum sustained winds of 65 mph (100 km/h).
  • 18:00 UTC (2:00 p.m. AST) – Tropical Storm Gaston attains its peak intensity with maximum sustained winds of 40 mph (65 km/h) and a minimum barometric pressure of 1005 mb (hPa; 29.68 inHg).
  • September 2

  • 06:00 UTC (2:00 a.m. EDT) – Hurricane Earl attains its peak intensity with maximum sustained winds of 145 mph (230 km/h) and a minimum barometric pressure of 927 mb (hPa; 27.37 inHg).
  • 18:00 UTC (2:00 p.m. EDT) – Hurricane Earl weakens to a Category 3 hurricane.
  • 18:00 UTC (2:00 p.m. AST) – Tropical Storm Gaston degenerates into a remnant area of low pressure roughly midway between Africa and the Lesser Antilles.
  • September 3

  • 00:00 UTC (8:00 p.m. EDT, September 2) – Hurricane Earl weakens to a Category 2 hurricane.
  • 12:00 UTC (8:00 a.m. EDT) – Hurricane Earl weakens to a Category 1 hurricane.
  • September 4

  • 00:00 UTC (8:00 p.m. EDT, September 3) – Hurricane Earl weakens to a tropical storm roughly 130 mi (210 km) south-southeast of Long Island, New York.
  • 00:00 UTC (8:00 p.m. AST, September 3) – Tropical Storm Fiona degenerates into a remnant area of low pressure roughly 95 mi (150 km) northeast of Bermuda.
  • 12:00 UTC (8:00 a.m. AST) – Tropical Storm Earl re-intensifies into a Category 1 hurricane.
  • 15:00 UTC (11:00 a.m. AST) – Hurricane Earl makes its first landfall near Liverpool, Nova Scotia, with winds of 75 mph (120 km/h).
  • 19:00 UTC (3:00 p.m. AST) – Hurricane Earl makes its second and final landfall in Prince Edward Island, and simultaneously weakens to a tropical storm, with winds of 70 mph (110 km/h).
  • September 5

  • 00:00 UTC (8:00 p.m. AST, September 4) – Tropical Storm Earl transitions into an extratropical cyclone in the Gulf of St. Lawrence.
  • 18:00 UTC (1:00 p.m. CDT) – Tropical Depression Ten develops from an area of low pressure in the southern Bay of Campeche.
  • September 6

  • 06:00 UTC (1:00 a.m. CDT) – Tropical Depression Ten intensifies into Tropical Storm Hermine.
  • September 7

  • 02:00 UTC (9:00 p.m. CDT September 6) – Tropical Storm Hermine attains its peak intensity with maximum sustained winds of 70 mph (110 km/h) and a minimum barometric pressure of 989 mb (hPa; 29.21 inHg) and simultaneously makes landfall near Matamoros, Mexico at that intensity.
  • September 8

  • 00:00 UTC (7:00 p.m. CDT, September 7) – Tropical Storm Hermine weakens to a tropical depression over central Texas.
  • 06:00 UTC (2:00 a.m. AST) – A tropical depression develops from an area of low pressure roughly 80 mi (130 km) southeast of the southernmost Cape Verde Islands.
  • 12:00 UTC (8:00 a.m. AST) – The tropical depression intensifies into Tropical Storm Igor.
  • September 9

  • 12:00 UTC (8:00 a.m. AST) – Tropical Storm Igor weakens to a tropical depression.
  • 18:00 UTC (1:00 p.m. CDT) – Tropical Depression Hermine transitions into a post-tropical cyclone over southeastern Kansas.
  • September 10

  • 12:00 UTC (8:00 a.m. AST) – Tropical Depression Igor re-intensifies into a tropical storm.
  • September 12

  • 00:00 UTC (8:00 p.m. AST, September 11) – Tropical Storm Igor intensifies into a Category 1 hurricane.
  • 06:00 UTC (2:00 a.m. AST) – Tropical Depression Twelve develops from an area of low pressure roughly 250 mi (400 km) southeast of the southernmost Cape Verde Islands.
  • 12:00 UTC (8:00 a.m. AST) – Hurricane Igor intensifies into a Category 2 hurricane.
  • 18:00 UTC (2:00 p.m. AST) – Hurricane Igor intensifies into a Category 4 hurricane.
  • 18:00 UTC (2:00 p.m. AST) – Tropical Depression Twelve intensifies into Tropical Storm Julia.
  • September 14

  • 12:00 UTC (8:00 a.m. AST) – Tropical Storm Julia intensifies into a Category 1 hurricane.
  • 12:00 UTC (8:00 a.m. EDT) – A tropical depression develops from an area of low pressure roughly 325 mi (525 km) east of Chetumal, Mexico.
  • 12:00 UTC (8:00 a.m. AST) – Tropical Storm Fiona attains its peak intensity with a minimum barometric pressure of 998 mb (hPa; 29.47 inHg).
  • 18:00 UTC (2:00 p.m. EDT) – The tropical depression intensifies into Tropical Storm Karl.
  • September 15

  • 00:00 UTC (8:00 p.m. AST, September 14) – Hurricane Igor attains its peak intensity with maximum sustained winds of 155 mph (250 km/h) and a minimum barometric pressure of 924 mb (hPa; 27.29 inHg).
  • 00:00 UTC (8:00 p.m. AST, September 14) – Hurricane Julia intensifies into a Category 2 hurricane.
  • 06:00 UTC (2:00 a.m. AST) – Hurricane Julia intensifies into a Category 3 hurricane.
  • 12:00 UTC (8:00 a.m. AST) – Hurricane Julia intensifies into a Category 4 hurricane and simultaneously attains its peak intensity with maximum sustained winds of 140 mph (220 km/h) and a minimum barometric pressure of 948 mb (hPa; 27.99 inHg).
  • 12:45 UTC (7:45 a.m. CDT) – Tropical Storm Karl makes its first landfall near Rio Huach, Mexico, with winds of 65 mph (100 km/h).
  • September 16

  • 00:00 UTC (8:00 p.m. AST, September 15) – Hurricane Julia weakens to a Category 3 hurricane.
  • 12:00 UTC (8:00 a.m. AST) – Hurricane Julia weakens to a Category 2 hurricane.
  • 18:00 UTC (2:00 p.m. AST) – Hurricane Julia weakens to a Category 1 hurricane.
  • 18:00 UTC (1:00 p.m. CDT) – Tropical Storm Karl intensifies into a Category 1 hurricane.
  • September 17

  • 00:00 UTC (7:00 p.m. CDT, September 16) – Hurricane Karl intensifies into a Category 2 hurricane.
  • 06:00 UTC (2:00 a.m. AST) – Hurricane Igor weakens to a Category 3 hurricane.
  • 12:00 UTC (7:00 a.m. CDT) – Hurricane Karl intensifies into a Category 3 hurricane and simultaneously attains its peak intensity with maximum sustained winds of 125 mph (205 km/h) and a minimum barometric pressure of 956 mb (hPa; 28.23 inHg).
  • 16:45 UTC (11:45 a.m. CDT) – Hurricane Karl makes its second and final landfall roughly 10 mi (20 km) northwest of Veracruz, Mexico, with winds of 115 mph (185 km/h).
  • 18:00 UTC (2:00 p.m. AST) – Hurricane Igor weakens to a Category 2 hurricane.
  • 18:00 UTC (1:00 p.m. CDT) – Hurricane Karl weakens to a Category 2 hurricane.
  • September 18

  • 00:00 UTC (8:00 p.m. AST, September 17) – Hurricane Julia weakens to a tropical storm.
  • 00:00 UTC (7:00 p.m. CDT, September 17) – Hurricane Karl weakens to a tropical storm.
  • 06:00 UTC (1:00 a.m. CDT) – Tropical Storm Karl weakens to a tropical depression.
  • 12:00 UTC (7:00 a.m. CDT) – Tropical Depression Karl dissipates roughly 75 mi (120 km) west-southwest of Veracruz.
  • 18:00 UTC (2:00 p.m. AST) – Hurricane Igor weakens to a Category 1 hurricane.
  • September 20

  • 18:00 UTC (2:00 p.m. AST) – Tropical Storm Julia degenerates into a remnant area of low pressure roughly 950 mi (1530 km) west of the Azores.
  • 18:00 UTC (2:00 p.m. AST) – Tropical Storm Fourteen develops from an area of low pressure roughly 400 mi (640 km) west of the Cape Verde Islands.
  • September 21

  • 00:00 UTC (8:00 p.m. AST, September 20) – Tropical Depression Fourteen intensifies into Tropical Storm Lisa.
  • 15:00 UTC (11:00 a.m. AST) – Hurricane Igor makes landfall near Cape Race, Newfoundland, with winds of 85 mph (140 km/h).
  • 18:00 UTC (2:00 p.m. AST) – Hurricane Igor transitions into an extratropical cyclone off the northeastern coast of Newfoundland.
  • September 22

  • 18:00 UTC (2:00 p.m. AST) – Tropical Storm Lisa weakens to a tropical depression.
  • September 23

  • 12:00 UTC (8:00 a.m. AST) – Tropical Depression Lisa re-intensifies into a tropical storm.
  • 12:00 UTC (8:00 a.m. EDT) – Tropical Depression Fifteen develops from an area of low pressure roughly 490 mi (790 km) east of Cabo Gracias a Dios.
  • 18:00 UTC (2:00 p.m. EDT) – Tropical Depression Fifteen intensifies into Tropical Storm Matthew roughly 410 mi (660 km) east of Cabo Gracias a Dios.
  • September 24

  • 18:00 UTC (1:00 p.m. CDT) – Tropical Storm Matthew attains its peak intensity with maximum sustained winds of 60 mph (95 km/h) and a minimum barometric pressure of 998 mb (hPa; 29.47 inHg).
  • 19:00 UTC (2:00 p.m. CDT) – Tropical Storm Matthew makes its first landfall roughly 20 mi (30 km) south of Cabo Gracias a Dios with winds of 60 mph (95 km/h).
  • 21:00 UTC (5:00 p.m. AST) – Tropical Storm Lisa intensifies into a Category 1 hurricane.
  • September 25

  • 00:00 UTC (8:00 p.m. AST, September 24) – Hurricane Lisa attains its peak intensity with maximum sustained winds of 85 mph (140 km/h) and a minimum barometric pressure of 982 mb (hPa; 29.00 inHg).
  • 12:00 UTC (8:00 a.m. AST) – Hurricane Lisa weakens to a tropical storm.
  • 15:00 UTC (10:00 a.m. CDT) – Tropical Storm Matthew makes its second and final landfall roughly 10 mi (20 km) north-northeast of Monkey River Town, Belize, with winds of 40 mph (65 km/h).
  • 18:00 UTC (1:00 p.m. CDT) – Tropical Storm Matthew weakens to a tropical depression.
  • September 26

  • 12:00 UTC (8:00 a.m. AST) – Tropical Storm Lisa weakens to a tropical depression.
  • 12:00 UTC (7:00 a.m. CDT) – Tropical Depression Matthew degenerates into a remnant area of low pressure.
  • 18:00 UTC (2:00 p.m. AST) – Tropical Depression Lisa degenerates into a remnant area of low pressure.
  • September 28

  • 12:00 UTC (8:00 a.m. EDT) – Tropical Storm Nicole develops from an area of low pressure roughly 65 mi (100 km) south of the Isle of Youth.
  • September 29

  • 12:00 UTC (8:00 a.m. EDT) – Tropical Storm Nicole attains its peak intensity with maximum sustained winds of 45 mph (75 km/h) and a minimum barometric pressure of 995 mb (hPa; 29.38 inHg).
  • 15:00 UTC (11:00 a.m. EDT) – Tropical Storm Nicole degenerates into a trough of low pressure over Cuba.
  • October

    October 6

  • 06:00 UTC (2:00 a.m. AST) – Subtropical Depression Seventeen develops from an area of low pressure roughly 230 mi (370 km) north-northwest of San Juan, Puerto Rico.
  • 12:00 UTC (8:00 a.m. AST) – Subtropical Depression Seventeen intensifies into Subtropical Storm Otto.
  • October 7

  • 12:00 UTC (8:00 a.m. AST)  Subtropical Storm Otto transitions into a tropical storm.
  • October 8

  • 12:00 UTC (8:00 a.m. AST) – Tropical Storm Otto intensifies into a Category 1 hurricane.
  • October 9

  • 00:00 UTC (8:00 p.m. AST, October 8) – Hurricane Otto attains its peak intensity with maximum sustained winds of 85 mph (140 km/h) and a minimum barometric pressure of 976 mb (hPa; 28.82 inHg).
  • October 10

  • 00:00 UTC (8:00 p.m. AST, October 9) – Hurricane Otto weakens to a tropical storm.
  • 06:00 UTC (2:00 a.m. AST) – Tropical Storm Otto transitions into an extratropical cyclone roughly 900 mi (1450 km) east-northeast of Bermuda.
  • October 11

  • 00:00 UTC (8:00 p.m. EDT, October 10) – A tropical depression develops from an area of low pressure roughly 100 mi (160 km) southeast of Cabo Gracias a Dios.
  • 06:00 UTC (2:00 a.m. EDT) – The tropical depression intensifies into Tropical Storm Paula.
  • 12:00 UTC (8:00 a.m. EDT) – Tropical Storm Paula makes its first landfall near Cabo Gracias a Dios with winds of 50 mph (85 km/h).
  • October 12

  • 00:00 UTC (8:00 p.m. EDT, October 11) – Tropical Storm Paula intensifies into a Category 1 hurricane.
  • 18:00 UTC (1:00 p.m. CDT) – Hurricane Paula intensifies into a Category 2 hurricane and simultaneously attains its peak intensity with maximum sustained winds of 105 mph (165 km/h) and a minimum barometric pressure of 981 mb (hPa; 28.97 inHg).
  • October 13

  • 18:00 UTC (1:00 p.m. CDT) – Hurricane Paula weakens to a Category 1 hurricane.
  • October 14

  • 12:00 UTC (8:00 a.m. EDT) – Hurricane Paula weakens to a tropical storm.
  • 15:00 UTC (11:00 a.m. EDT) – Tropical Storm Paula makes its second and final landfall between St. Lucia, Cuba and Puerto Esperanza, Cuba, with winds of 65 mph (100 km/h).
  • October 15

  • 06:00 UTC (2:00 a.m. EDT) – Tropical Storm Paula weakens to a tropical depression.
  • 12:00 UTC (8:00 a.m. EDT) – Tropical Depression Paula degenerates into a remnant area of low pressure.
  • October 20

  • 06:00 UTC (2:00 a.m. EDT) – Tropical Depression Nineteen develops from an area of low pressure roughly 170 mi (270 km) north of Cabo Gracias a Dios.
  • October 21

  • 12:00 UTC (8:00 a.m. EDT) – Tropical Depression Nineteen intensifies into Tropical Storm Richard roughly 180 mi (290 km) northeast of Cabo Gracias a Dios.
  • October 24

  • 06:00 UTC (1:00 a.m. CDT) – Tropical Storm Richard intensifies into a Category 1 hurricane.
  • October 25

  • 00:00 UTC (7:00 p.m. CDT, October 24) – Hurricane Richard intensifies into a Category 2 hurricane and simultaneously attains its peak intensity with maximum sustained winds of 100 mph (160 km/h) and a barometric pressure of 977 mb (hPa; 28.85 inHg).
  • 00:30 UTC (7:30 p.m. CDT October 24) – Hurricane Richard makes landfall near Gales Point, Belize, with maximum sustained winds of 100 mph (160 km/h).
  • 06:00 UTC (1:00 a.m. CDT) – Hurricane Richard weakens to a Category 1 hurricane.
  • 12:00 UTC (7:00 a.m. CDT) – Hurricane Richard weakens to a tropical storm.
  • 18:00 UTC (1:00 p.m. CDT) – Tropical Storm Richard weakens to a tropical depression roughly 115 mi (175 km) south of Campeche.
  • October 26

  • 00:00 UTC (7:00 p.m. CDT, October 25) – Tropical Depression Richard degenerates into a remnant area of low pressure roughly 20 mi (30 km) southeast of Ciudad del Carmen.
  • October 28

  • 18:00 UTC (2:00 p.m. AST) – A tropical depression develops from an area of low pressure roughly 450 mi (720 km) south-southeast of Bermuda.
  • October 29

  • 00:00 UTC (8:00 p.m. AST, October 28) – The tropical depression intensifies into Tropical Storm Shary.
  • 06:00 UTC (2:00 a.m. AST) – A tropical depression develops from an area of low pressure roughly 400 mi (640 km) southeast of Barbados.
  • 12:00 UTC (8:00 a.m. AST) – The tropical depression intensifies into Tropical Storm Tomas.
  • October 30

  • 00:00 UTC (8:00 p.m. AST, October 29) – Tropical Storm Shary intensifies into a Category 1 hurricane.
  • 06:00 UTC (2:00 a.m. AST) – Hurricane Shary attains its peak intensity with maximum sustained winds of 75 mph (120 km/h) and a minimum barometric pressure of 989 mb (hPa; 29.21 inHg).
  • 0900 UTC (5:00 a.m. AST) – Tropical Storm Tomas makes its first landfall on the south coast of Barbados with winds of 70 mph (110 km/h).
  • 12:00 UTC (8:00 a.m. AST) – Tropical Storm Tomas intensifies into a Category 1 hurricane.
  • 18:00 UTC (2:00 p.m. AST) – Hurricane Shary transitions into an extratropical cyclone several hundred miles south of Newfoundland.
  • 20:00 UTC (4:00 p.m. AST) – Hurricane Tomas intensifies into a Category 2 hurricane and simultaneously makes its second landfall on the north coast of Saint Vincent with winds of 100 mph (160 km/h).
  • October 31

  • 00:00 UTC (8:00 p.m. AST, October 30) – Hurricane Tomas attains its peak intensity with maximum sustained winds of 100 mph (160 km/h) and a minimum barometric pressure of 982 mb (hPa; 29.00 inHg).
  • 12:00 UTC (8:00 a.m. AST) – Hurricane Tomas weakens to a Category 1 hurricane.
  • November

    November 1

  • 00:00 UTC (8:00 p.m. EDT, October 31) – Hurricane Tomas weakens to a tropical storm.
  • November 3

  • 00:00 UTC (8:00 p.m. EDT, November 2) – Tropical Storm Tomas weakens to a tropical depression.
  • 18:00 UTC (2:00 p.m. EDT) – Tropical Depression Tomas re-intensifies into a tropical storm.
  • November 5

  • 06:00 UTC (2:00 a.m. EDT) – Tropical Storm Tomas re-intensifies into a Category 1 hurricane.
  • November 6

  • 00:00 UTC (8:00 p.m. EDT, November 5) – Hurricane Tomas weakens to a tropical storm.
  • 18:00 UTC (2:00 p.m. AST) – Tropical Storm Tomas re-intensifies into a Category 1 hurricane.
  • November 7

  • 12:00 UTC (8:00 a.m. AST) – Hurricane Tomas weakens to a tropical storm.
  • November 8

  • 00:00 UTC (8:00 p.m. AST, November 7) – Tropical Storm Tomas transitions into an extratropical cyclone south of Newfoundland.
  • November 30

  • The 2010 Atlantic hurricane season officially ends.
  • References

    Timeline of the 2010 Atlantic hurricane season Wikipedia