
2016 2017 100,504 138,856 178,391 229,300 | Cumulative 100,504 138,856 178,391 229,300 302,300 | |
 | ||
Worldwide growth of photovoltaics has been fitting an exponential curve for more than two decades. During this period of time, photovoltaics (PV), also known as solar PV, has evolved from a pure niche market of small scale applications towards becoming a mainstream electricity source. When solar PV systems were first recognized as a promising renewable energy technology, programs, such as feed-in tariffs, were implemented by a number of governments in order to provide economic incentives for investments. For several years, growth was mainly driven by Japan and pioneering European countries. As a consequence, cost of solar declined significantly due to improvements in technology and economies of scale, even more so when production of solar cells and modules started to ramp up in China. Since then, deployment of photovoltaics is gaining momentum on a worldwide scale, particularly in Asia but also in North America and other regions, where solar PV is now increasingly competing with conventional energy sources as grid parity has already been reached in about 30 countries.
Contents
- Current status
- Worldwide
- Regions
- Countries
- Forecast for 2016
- Forecast for 2015
- Global short term forecast 2020
- Global long term forecast 2050
- Regional forecasts
- History of leading countries
- United States 19541996
- Japan 19972004
- Germany 20052014
- China 2015present
- Prices and costs 1977present
- Technologies 1990present
- Silicon shortage 20052008
- Solar overcapacity 20092013
- Anti dumping duties 2012present
- History of deployment
- Worldwide annual deployment
- Worldwide cumulative
- Deployment by country
- References
Projections for photovoltaic growth are difficult and burdened with many uncertainties. Official agencies, such as the International Energy Agency consistently increased their estimates over the years, but still fell short of actual deployment.
Historically, the United States had been the leader of installed photovoltaics for many years, and its total capacity amounted to 77 megawatts in 1996—more than any other country in the world at the time. Then, Japan stayed ahead as the world's leader of produced solar electricity until 2005, when Germany took the lead. The country is currently approaching the 40,000 megawatt mark. China is expected to continue its rapid growth and to triple its PV capacity to 70,000 megawatts by 2017. In 2015, China became world's largest producer of photovoltaic power. By the end of 2015, cumulative photovoltaic capacity reached at least 227 gigawatts (GW), sufficient to supply 1 percent of global electricity demands. Solar now contributes 8%, 7.4% percent and 7.1 percent to the respective annual domestic consumption in Italy, Greece and Germany. For 2016, worldwide deployment of up to 77 GW is being forecasted, and installed capacity is projected to more than double or even triple beyond 500 GW between now and 2020. By 2050, solar power is anticipated to become the world's largest source of electricity, with solar photovoltaics and concentrated solar power contributing 16 and 11 percent, respectively. This will require PV capacity to grow to 4,600 GW, of which more than half is forecasted to be deployed in China and India.
Current status
Current status describes worldwide, regional and domestic solar PV deployment as of the end of 2014 (see section Forecast for 2015). The unit of power, watt, is frequently used as multiples, such as kilowatt (kW), megawatt (MW), gigawatt (GW) and terawatt (TW). Nameplate capacity in the article is displayed as MW and has to be understood as direct current megawatt-peak (MWp), if not otherwise explicitly denoted as, for example, MWAC
At the utility level, wind power competes for new installations, it has a better capacity factor and about four times the 2015 electricity production compared to solar power.
For a complete history of deployment over the last two decades, also see section History of deployment.
Worldwide
In 2014, cumulative photovoltaic capacity increased by 40.1 GW or 28% and reached at least 178 GW by the end of the year, sufficient to supply 1 percent of the world's total electricity consumption of currently 18,400 TWh. Although this represents a new all-time record in the history of global PV deployment, overall expectations had been higher as module shipments amounted to 44–46 GW and suggested higher overall installations. Annual installation for 2014 expanded slightly by 5% when compared to worldwide installation of 38.3 GW in 2013.
Regions
In 2014, Asia was the fastest growing region, with more than 60% of global installations. China and Japan alone accounted for 20 GW or half of worldwide deployment. Europe continued to decline and installed 7 GW or 18% of the global PV market, three times less than in the record-year of 2011, when 22 GW had been installed. For the first time, North and South America combined accounted for at least as much as Europe, about 7.1 GW or about 18% of global total. This is due to the strong growth in the United States, supported by Canada, Chile and Mexico.
In terms of cumulative capacity, Europe is still the most developed region with 88 GW or half of the global total of 178 GW. Solar PV now covers 3.5% and 7% of European electricity demand and peak electricity demand, respectively. The Asia-Pacific region (APAC) which includes countries such as Japan, India and Australia, follows second and accounts for about 20% percent of worldwide capacity. In third position ranks China with 16%, followed by the Americas with about 12%. Cumulative capacity in the MEA (Middle East and Africa) region and ROW (rest of the world) accounted for only about 3.3% of the global total. A great untapped potential remains for many of these countries, especially in the Sunbelt.
Countries
As in the year before, the world's top installer of 2014 were China (+10.6 GW), followed by Japan (+9.6 GW) and the United States (+6.2 GW), while the United Kingdom (+2.3 GW) emerged as new European leader ahead of Germany (+1.9 GW) and France (+0.9 GW). Germany remains for one more year the world's largest producer of solar power with an overall installed capacity of 38.2 GW.
Chile (+0.4 GW) and South Africa (+0.8 GW) were the newcomers of 2014. South Africa entered the top 10 in added capacity rankings for the first time. There are now twenty countries around the world with a cumulative PV capacity of more than one gigawatt (see bar-chart below). Thailand (1,299 MW), The Netherlands (1,123 MW), and Switzerland (1,076 MW), all crossed the gigawatt threshold in 2014. Based on IEA's data, the available solar PV capacity in Italy, Germany and Greece is now sufficient to supply between 7% and 8% of their respective domestic electricity consumption.
Other mentionable PV deployments above the 100-megawatt mark included Canada (500 MW), Thailand (475 MW), The Netherlands (400 MW), Taiwan (400 MW), Italy (385 MW), Chile (1,113 MW), Switzerland (320 MW), Israel (250 MW), Austria (140 MW) and Portugal (110 MW). Underperforming countries were Belgium (65 MW), Bulgaria (2 MW), the Czech Republic (2 MW), Greece (16 MW), Romania (69 MW), Slovakia (0.4 MW) and Spain (22 MW), with very low to almost non-existent additions compared to previous years.
Forecast for 2016
In April 2016, Mercom Capital Group, forecasted global solar installations to reach 66.7 GW with China, the United States, Japan and India to make up the top four solar markets in 2016. However, in December 2016, Mercom increased their 2016 forecast to 76GW.
Market research firm IHS forecast in February global installations to reach 69 GW in 2016. Meanwhile, Greentech Media has a 2016 forecast of 64 GW. In December 2016, IHS updated their 2016 forecast to 77GW.
Forecast for 2015
In June 2015, SolarPower Europe (SPE) – the former European Photovoltaic Industry Association (EPIA) – released its new report, Global Market Outlook for Solar Power 2015–2019. The European PV organization expects global installations to grow between 41 GW and 60 GW, marked by their low and high scenario, respectively. A year before, the European lobby association estimated 2015 to grow by 35–53 GW.
The International Energy Agency (IEA) will still have to update its forecast in the course of 2015. This is expected to happen on 1 October 2015, when the Medium-Term Renewable Energy Market Report 2015 will be launched on the sidelines of the G20 summit in Istanbul, Turkey. In August 2014, IEA forecasted 38 GW in its baseline scenario for 2015. The IEA has been criticized for systematically underestimating the growth of photovoltaics in the past.
IHS Technology forecasts global solar PV installations to grow by 59 GW or 33% in 2015. The company also predicts an accelerated growth for concentrator photovoltaics, an increase in market-share of monocrystalline silicon technology over polycrystalline silicon, currently the leading semiconductor material used for solar cells (also see section Technologies), and that solar power in California will provide more than 10 percent of the state's annual power generation, higher than in Italy and Germany.
Deutsche Bank (DB) anticipates deployment to reach about 54 GW in 2015. An increase in investments and improvement of cost competitiveness is expected, while weaker oil prices are not seen to play a significant role for the solar sector. They find that grid parity has arrived in 30 countries around the world (compared to 19 markets the year before), as unsubsidized rooftop solar costs $0.08–$0.13 per kilowatt-hour, and is now below the retail prices of electricity in these markets. DB also estimates current installation cost to range from $1.00/W for utility-scale systems in China to $2.90/W for U.S. residential rooftop systems.
For 2015, Mercom Capital (MC) predicts global installation to amount to 57.8 GW (up from 54.5 GW predicted a few months earlier), while Bloomberg New Energy Finance (BNEF) foresees solar PV to add more than 55 GW. The 10 Predictions For Clean Energy In 2015 by Michael Liebreich mentions the spread of PV to more and more localities in Africa, the trend of imposing taxes on rooftop systems, and the growing confidence among investors that solar is indeed a cheap source of power. In June 2015, Greentech Media (GTM) Research estimated global PV installations at 55 GW for 2015 and notes that this corresponds to about half of the world's newly installed electricity generating capacity.
About 40 countries are expected to install more than 100 megawatts in 2015 (compared to 25 countries in 2014). In the United States, installations are predicted to grow by 7.9 GW (SEIA) to 9.4 GW, up by about 30–45% over the record-year of 2014. Both, the United Kingdom (2.9–3.5 GW) and Japan (9–10.4 GW) are being forecasted to set new records in 2015. After three years of decline, installations in Europe are expected to grow again to 9.4 GW, up 19% over 2014. The Chinese government set its own 2015 solar target to 17.8 GW, much higher than its original 2014 target it ultimately missed to achieve. India is expected to install more than 2 GW, a tripling over the previous year. A return of deployment in the gigawatt-scale is predicted for France, and record installations of 1.1 GW are expected for Thailand, while deployment in Australia and Germany would remain unchanged. Latin America is forecasted to install 2.2 GW in 2015, with a significant contribution from the Central American region for the first time, while Chile and Mexico are expected to double and triple their installations, respectively. The projected top five Latin American installers of 2015 are Chile (1 GW), Honduras (460 MW), Mexico (195 MW), Guatemala (98 MW) and Panama (62 MW). Rapid growth of solar PV is also expected to occur in Jordan, Pakistan and the Philippines.
Global short-term forecast (2020)
There are a number of short and medium term forecasts published by several organizations and market research companies. In addition, the International Energy Agency (IEA) and Solar Power Europe (SPE, the former EPIA) produce more than one scenario each. The summary table shows the different forecasts for global PV capacity by 2020. Projections are listed by ascending cumulative capacity. The table also shows the capacity that has to be installed from 2015–2020 and the average annual installation required to meet the projection. Conservative scenarios forecast capacity to reach 400 or more gigawatts, assuming declining annual installations from current levels, while more optimistic scenarios project cumulative capacity to grow beyond 500 GW. Only the most optimistic projections around 600 GW foresee annual installations to grow above 10 percent (p.a) in the near future.
The European Photovoltaic Industry Association expects the fastest PV growth to continue in China, South-East Asia, Latin America, the Middle-East, North Africa, and India. By 2019, worldwide capacity is projected to reach between 396 GW (low scenario) and 540 GW (high scenario). This corresponds to a more than doubling and tripling of installed capacity within five years, respectively.
Consulting firm Frost & Sullivan projects global PV capacity to increase to 446 GW by 2020, with China, India and North America being the fastest growing regions, while Europe is expected to double its solar capacity from current levels. Grand View Research, a market research and consulting firm, headquartered in San Francisco, published its solar PV forecast report in March 2015. The large PV potential in countries such as Brazil, Chile and Saudi Arabia has not expanded as expected and is supposed to be explored over the next six years. In addition, China's increase of manufacturing capacity is expected to further lowering global market prices. The consulting firm projects worldwide cumulative deployment to reach about 490 GW by 2020.
The PV Market Alliance (PVMA), a recently founded consortium of several research bodies, sees global PV capacity to reach 444–630 GW by 2020. In its low scenario, annual installations are projected to grow from 40 to 50 gigawatts by the end of the decade, while its high scenario forecasts deployment to increase from 60 to 90 GW during the next five years. The medium scenario therefore expects annual PV installations to grow from 50 GW to 70 GW and to reach 536 GW by 2020. PVMA's figures are in line with those published earlier by Solar Power Europe. In June 2015, Greentech Media (GTM) Research released its Global PV Demand Outlook for 2020. The company projects annual installations to increase from 40 GW to 135 GW and global cumulative capacity to reach almost 700 GW by 2020. GTM's outlook is the most aggressive of all forecasts to date, with projected deployment of 518 GW between 2015 and 2020, or more than twice as much as IEA's 225 GW baseline case scenario, published ten months earlier.
The International Energy Agency (IEA) sees overall stagnating annual installations in the range of 36–39 GW until 2020, when global capacity will reach 403 GW, according to the highlighted baseline case scenario of the Medium Term Renewable Energy Market 2014 report. Paradoxically, since the report's 2013-edition, projected cumulative for 2018 has increased by 6% from 308 GW to 326 GW, while the corresponding annual deployment decreased. This is due to the fact that the International Energy Agency adjusted annual installations upward on the near-end – in order to meet actual deployment, while reducing estimates on the far-end. The result is a flat curve that stays below 40 GW until 2020 (see table). For 2017, the projected low of 36 GW concurs with the scheduled expiration of the solar investment tax credit (ITC) in the U.S. and the expected end of the solar boom in Japan. IEA's projected annual installation of less than 40 GW also leads to a negative growth rate, since expectations for 2015 are much higher (see Forecast for 2015). Such a decline, however, is unprecedented and has never been observed in the recorded history of solar PV deployment. This scenario makes IEA's baseline case the most conservative of all projections. In the less featured enhanced high case scenario, IEA estimates that "solar PV could reach a cumulative 465 GW to 515 GW in 2020" and that "solar PV capacity could top 500 GW globally in 2020".
By 2020, IEA's Technology Roadmap: Solar Photovoltaic Energy report expects China to account for over 110 GW of solar PV, while Japan and Germany would each reach around 50 GW. The United States would rank fourth at over 40 GW, followed by Italy and India with 25 GW and 15 GW. The United Kingdom, France and Australia, would have installed capacities of close to 10 GW each. IEA released this outlook in September 2014 (see section below for more detail on the report). Two months later, however, India announced its intention to install 100 GW of solar PV by 2022, and another six months later, SEIA forecasted that the United States would reach 40 GW of cumulative PV capacity already by the end of 2016. Furthermore, in July 2015, the UK was forecast to reach 10 GW by early 2016. IEA will release its next roadmap report on solar PV in 2018.
Global long-term forecast (2050)
In 2014, the International Energy Agency (IEA) released its latest edition of the Technology Roadmap: Solar Photovoltaic Energy report, calling for clear, credible and consistent signals from policy makers. The IEA also acknowledged to have previously underestimated PV deployment and reassessed its short-term and long-term goals.
IEA report Technology Roadmap: Solar Photovoltaic Energy (September 2014) —
Much has happened since our 2010 IEA technology roadmap for PV energy. PV has been deployed faster than anticipated and by 2020 will probably reach twice the level previously expected. Rapid deployment and falling costs have each been driving the other. This progress, together with other important changes in the energy landscape, notably concerning the status and progress of nuclear power and CCS, have led the IEA to reassess the role of solar PV in mitigating climate change. This updated roadmap envisions PV's share of global electricity rising up to 16% by 2050, compared with 11% in the 2010 roadmap.IEA's long-term scenario for 2050 describes worldwide solar photovoltaics (PV) and concentrated solar thermal (CSP) capacity to reach 4,600 GW and 1,000 GW, respectively. In order to achieve IEA's projection, PV deployment of 124 GW and investments of $225 billion are required annually. This is about three and two times of current levels, respectively. By 2050, levelized cost of electricity (LCOE) generated by solar PV would cost between US 4¢ and 16¢ per kilowatt-hour (kWh), or by segment and on average, 5.6¢ per kWh for utility-scale power plants (range of 4¢ to 9.7¢), and 7.8¢ per kWh for solar rooftop systems (range of 4.9¢ to 15.9¢) These estimates are based on a weighted average cost of capital (WACC) of 8%. The report notes that when the WACC exceeds 9%, over half the LCOE of PV is made of financial expenditures, and that more optimistic assumptions of a lower WACC would therefore significantly reduce the LCOE of solar PV in the future. The IEA also emphasizes that these new figures are not projections but rather scenarios they believe would occur if underlying economic, regulatory and political conditions played out.
In 2015, Fraunhofer ISE did a study commissioned by German renewable think tank Agora Energiewende and concluded that most scenarios fundamentally underestimate the role of solar power in future energy systems. Fraunhofer's study (see summary of its conclusions below) differs significantly form IEA's roadmap report on solar PV technology despite being published only a few months apart. The report foresees worldwide installed PV capacity to reach as much as 30,700 GW by 2050. By then, Fraunhofer expects LCOE for utility-scale solar farms to reach €0.02 to €0.04 per kilowatt-hour, or about half of what the International Energy Agency has been projecting (4¢ to 9.7¢). Turnkey system costs would decrease by more than 50% to €436/kWp from currently €995/kWp. This is also noteworthy, as IEA's roadmap published significantly higher estimates of $1,400 to $3,300 per kWp for eight major markets around the world (see table Typical PV system prices in 2013 below). However, the study agrees with IEA's roadmap report by emphasizing the importance of the cost of capital (WACC), which strongly depends on regulatory regimes and may even outweigh local advantages of higher solar insolation. In the study, a WACC of 5%, 7.5% and 10% is used to calculate the projected levelized cost of electricity for utility-scale solar PV in 18 different markets worldwide.
Fraunhofer ISE: Current and Future Cost of Photovoltaics. Long-term Scenarios for Market Development, System Prices and LCOE of Utility-Scale PV Systems. Study on behalf of Agora Energiewende (February 2015) —
- Solar photovoltaics is already today a low-cost renewable energy technology. Cost of power from large scale photovoltaic installations in Germany fell from over 40 ct/kWh in 2005 to 9 cts/kWh in 2014. Even lower prices have been reported in sunnier regions of the world, since a major share of cost components is traded on global markets.
- Solar power will soon be the cheapest form of electricity in many regions of the world. Even in conservative scenarios and assuming no major technological breakthroughs, an end to cost reduction is not in sight. Depending on annual sunshine, power cost of 4–6 cts/kWh are expected by 2025, reaching 2–4 ct/kWh by 2050 (conservative estimate).
- Financial and regulatory environments will be key to reducing cost in the future. Cost of hardware sourced from global markets will decrease irrespective of local conditions. However, inadequate regulatory regimes may increase cost of power by up to 50 percent through higher cost of finance. This may even overcompensate the effect of better local solar resources.
- Most scenarios fundamentally underestimate the role of solar power in future energy systems. Based on outdated cost estimates, most scenarios modeling future domestic, regional or global power systems foresee only a small contribution of solar power. The results of our analysis indicate that a fundamental review of cost-optimal power system pathways is necessary.
Regional forecasts
History of leading countries
Since the 1950s, when the first solar cells were commercially manufactured, there has been a succession of countries leading the world as the largest producer of electricity from solar photovoltaics. First it was the United States, then Japan, followed by Germany, and currently China.
United States (1954–1996)
The United States, inventor of modern solar PV, was the leader of installed capacity for many years. Based on preceding work by Swedish and German engineers, the American engineer Russell Ohl at Bell Labs patented the first modern solar cell in 1946. It was also there at Bell Labs where the first practical c-silicon cell was developed in 1954. Hoffman Electronics, the leading manufacturer of silicon solar cells in the 1950s and 1960s, improved on the cell's efficiency, produced solar radios, and equipped Vanguard I, the first solar powered satellite launched into orbit in 1958.
In 1977 US-President Jimmy Carter installed solar hot water panels on the White House promoting solar energy and the National Renewable Energy Laboratory, originally named Solar Energy Research Institute was established at Golden, Colorado. In the 1980s and early 1990s, most photovoltaic modules were used in stand-alone power systems or powered consumer products such as watches, calculators and toys, but from around 1995, industry efforts have focused increasingly on developing grid-connected rooftop PV systems and power stations. By 1996, solar PV capacity in the US amounted to 77 megawatts–more than any other country in the world at the time. Then, Japan stayed ahead.
Japan (1997–2004)
Japan took the lead as the world's largest producer of PV electricity, after the city of Kobe was hit by the Great Hanshin earthquake in 1995. Kobe experienced severe power outages in the aftermath of the earthquake, and PV systems were then considered as a temporary supplier of power during such events, as the disruption of the electric grid paralyzed the entire infrastructure, including gas stations that depended on electricity to pump gasoline. Moreover, in December of that same year, an accident occurred at the multibillion-dollar experimental Monju Nuclear Power Plant. A sodium leak caused a major fire and forced a shutdown (classified as INES 1). There was massive public outrage when it was revealed that the semigovernmental agency in charge of Monju had tried to cover up the extent of the accident and resulting damage. Japan remained world leader in photovoltaics until 2004, when its capacity amounted to 1,132 megawatts. Then, focus on PV deployment shifted to Europe.
Germany (2005–2014)
In 2005, Germany took the lead from Japan. With the introduction of the Renewable Energy Act in 2000, feed-in tariffs were adopted as a policy mechanism. This policy established that renewables have priority on the grid, and that a fixed price must be paid for the produced electricity over a 20-year period, providing a guaranteed return on investment irrespective of actual market prices. As a consequence, a high level of investment security lead to a soaring number of new photovoltaic installations that peaked in 2011, while investment costs in renewable technologies were brought down considerably. Germany's installed PV capacity is now approaching the 40,000 megawatt mark.
China (2015–present)
China surpassed Germany's capacity by the end of 2015, becoming the world's largest producer of photovoltaic power. China's rapid PV growth continued in 2016 – with 34.2 GW of solar photovoltaics installed. The quickly lowering feed in tariff rates at the end of 2015 motivated many developers to secure tariff rates before mid-year 2016 – as they were anticipating further cuts (correctly so). During the course of the year, China announced its goal of installing 100 GW during the next Chinese Five Year Economic Plan (2016–2020). China expects to spend ¥1 trillion ($145B) on solar construction during that period.
Prices and costs (1977–present)
The average price per watt has dropped drastically for solar cells over the last few decades. While in 1977 prices for crystalline silicon cells were about $77 per watt, average spot prices in June 2014 were as low as $0.36 per watt or 200 times less than almost forty years ago. Prices for thin-film solar cells and for c-Si solar panels were around $.60 per watt. In 2015, module and cell prices declined even further (see price quotes in table).
This price trend is seen as evidence supporting Swanson's law, an observation similar to the famous Moore's Law that states that the per-watt cost of solar cells and panels fall by 20 percent for every doubling of cumulative photovoltaic production. A 2015 study shows price/kWh dropping by 10% per year since 1980, and predicts that solar could contribute 20% of total electricity consumption by 2030.
In its 2014 edition of the Technology Roadmap: Solar Photovoltaic Energy report, the International Energy Agency (IEA) published prices for residential, commercial and utility-scale PV systems for eight major markets as of 2013 (see table below). However, IEA's figures for the U.S seem to be controversial, as DOE's SunShot Initiative report states lower prices, although being published at the same time and referring to the same period. Prices have since fallen further. For 2014, the SunShot Initiative modeled U.S. system prices to be in the range of $1.80 to $3.29 per watt. Other sources identify similar price ranges of $1.70 to $3.50 for the different market segments in the U.S., and in the highly penetrated German market, prices for residential and small commercial rooftop systems of up to 100 kW declined to $1.36 per watt (€1.24/W) by the end of 2014. In 2015, Deutsche Bank estimated costs for small residential rooftop systems in the U.S. around $2.90 per watt. Costs for utility-scale systems in China and India were estimated as low as $1.00 per watt. As of mid-2015, a residential 5 kW-system in Australia costs on average about AU$1.60, or US$1.23 per watt.
Technologies (1990–present)
With the advances in conventional crystalline silicon (c-Si) technology in recent years, and the falling cost of the polysilicon since 2009, that followed after a period of severe shortage (see below) of silicon feedstock, pressure increased on manufacturers of commercial thin-film PV technologies, including amorphous thin-film silicon (a-Si), cadmium telluride (CdTe), and copper indium gallium diselenide (CIGS), leading to the bankruptcy of several, once highly touted thin-film companies. The sector continues to face price competition from Chinese crystalline silicon cell and module manufacturers, and some companies together with their patents were sold below cost.
In 2013 thin-film technologies accounted for about 9 percent of worldwide deployment, while 91 percent was held by crystalline silicon (mono-Si and multi-Si). With 5 percent of the overall market, CdTe holds more than half of the thin-film market, leaving 2 percent to each, CIGS and amorphous silicon.
Silicon shortage (2005–2008)
In the early 2000s, prices for polysilicon, the raw material for conventional solar cells, were as low as $30 per kilogram and silicon manufacturers had initially no incentive to expand production by additional investments.
However, a severe silicon shortage came along in 2005, when governmental programmes sparked the deployment of solar PV to rise by 75% in Europe. In addition, the demand for silicon from semiconductor manufacturers was growing as well. Since the amount of silicon needed for semiconductors makes up a much smaller portion of production costs, manufacturers were able to outbid solar companies for the available silicon in the market.
Initially, the incumbent polysilicon producers were slow to respond to rising demand for solar applications, because of their painful experiences with over-investment in the past. Silicon prices sharply rose to about $80 per kilogram, and reached as much as $400/kg for long-term contracts and spot prices. In 2007, the constraints on silicon became so severe that the solar industry was forced to idle about a quarter of its cell and module manufacturing capacity—an estimated 777 MW of the then available production capacity. The shortage also provided silicon specialists with both the cash and an incentive to develop new technologies and several new producers entered the market. Early responses from the solar industry focused on improvements in the recycling of silicon. When this potential was exhausted, companies have been taking a harder look at alternatives to the conventional Siemens process.
As it takes about three years to build a new polysilicon plant, the shortage prolonged until 2008. Prices for conventional solar cells remained constant or even rose slightly during the period of silicon shortage from 2005 to 2008. This is notably seen as a "shoulder" that sticks out in the Swanson's PV-learning curve and it was feared that a prolonged shortage could delay solar power to become competitive with conventional energy prices without subsidies.
In the meantime the solar industry lowered the number of grams-per-watt by reducing wafer thickness and kerf loss, increased yields in all manufacturing steps, reducing module loss, and continuously raised panel efficiency. Finally, the ramp up of polysilicon production alleviated worldwide markets from the scarcity of silicon in 2009 and subsequently lead to an overcapacity with sharply declining prices in the photovoltaic industry for the following years.
Solar overcapacity (2009–2013)
As the polysilicon industry had started to build additional large production capacities during the shortage period, prices dropped as low as $15 per kilogram forcing some producers to suspend production or exit the sector. Since then, prices for silicon have stabilized around $20 per kilogram and the booming solar PV market has also helped to reduce the enormous global overcapacity since 2009. However, overcapacity in the PV industry continues to persist. In 2013, global record deployment of 38 GW (updated EPIA figure) was still much lower than China's annual production capacity of approximately 60 GW. Continued overcapacity was further reduced by significantly lowering solar module prices and, as a consequence, many manufacturers could no longer cover costs or remain competitive. As worldwide growth of PV deployment continues and will likely break another record in 2014, the gap between overcapacity and global demand is expected to close in the next few years.
IEA-PVPS published historical data for the worldwide utilization of solar PV module production capacity that displays a slow return to normalization in manufacture in recent years. The utilization rate is the ratio of production capacities versus actual production output for a given year. A low of 49% was reached in 2007 and reflects the peak of the silicon shortage that idled a significant share of the module production capacity. As of 2013, the utilization rate had recovered somewhat and increased to 63%.
Anti-dumping duties (2012–present)
After anti-dumping petition were filed and investigations carried out, the United States imposed tariffs of 31 percent to 250 percent on solar products imported from China in 2012. A year later, the EU also imposed definitive anti-dumping and anti-subsidy measures on imports of solar panels from China at an average of 47.7 percent for a two-year time span.
Shortly thereafter, China, in turn, levied duties on U.S. polysilicon imports, the feedstock for the production of solar cells. In January 2014, the Chinese Ministry of Commerce set its anti-dumping tariff on U.S. polysilicon producers, such as Hemlock Semiconductor Corporation to 57%, while other major polysilicon producing companies, such as German Wacker Chemie and Korean OCI were much less affected. All this has caused much controversy between proponents and opponents and is subject of current debate.
History of deployment
Deployment figures on a global, regional and nationwide scale are well documented since the early 1990s. While worldwide photovoltaic capacity has been growing continuously, deployment figures by country are much more dynamic, as they depend strongly on national policies. A number of organizations release comprehensive reports on PV deployment on a yearly basis. They include annual and cumulative deployed PV capacity, typically given in watt-peak, a break-down by markets, as well as in-depth analysis and forecasts about future trends.
Worldwide annual deployment
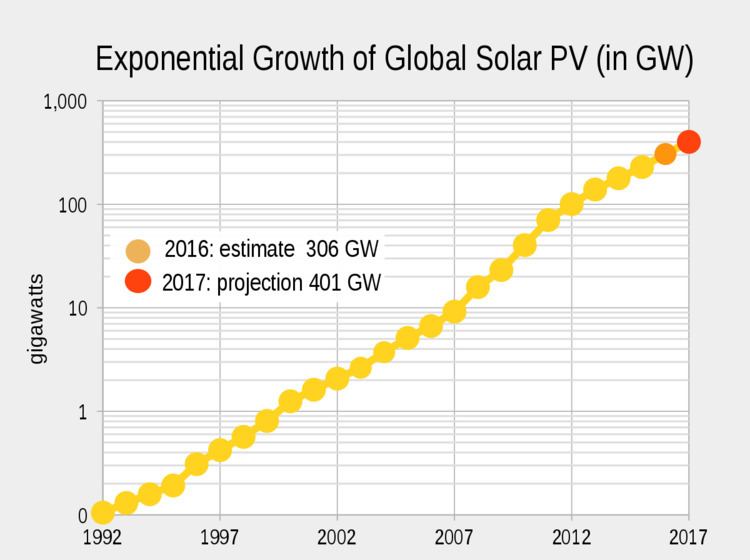
Due to the exponential nature of PV deployment, most of the overall capacity has been installed in recent years (see pie-chart). Since the 1990s, each year has been a record-breaking year in terms of newly installed PV capacity, except for 2012, and possibly 2017.
Worldwide cumulative
Worldwide growth of solar PV capacity has been fitting an exponential curve since 1992. Tables below show global cumulative nominal capacity by the end of each year in megawatts, and the year-to-year increase in percent. In 2014, global capacity is expected to grow by 33 percent from 138,856 to 185,000 MW. This corresponds to an exponential growth rate of 29 percent or about 2.4 years for current worldwide PV capacity to double. Exponential growth rate: P(t) = P0ert, where P0 is 139 GW, growth-rate r 0.29 (results in doubling time t of 2.4 years).
The following table contains data from four different sources. For 1992–1995: compiled figures of 16 main markets (see section All time PV installations by country). For 1996–1999: BP-Statistical Review of world energy (Historical Data Workbook) for 2000–2013: EPIA Global Outlook on Photovoltaics Report and for 2014, preliminary figures are based on IEA-PVPS' snapshot report