
 | ||
A learning curve is a graphical representation of the increase of learning (vertical axis) with experience (horizontal axis).
Contents
- In psychology
- In economics
- Examples and mathematical modeling
- In machine learning
- Broader interpretations
- General learning limits
- Steep learning curve
- ON a steep learning curve
- References
The term learning curve is used in two main ways: where the same task is repeated in a series of trials, or where a body of knowledge is learned over time. The first person to describe the learning curve was Hermann Ebbinghaus in 1885, in the field of the psychology of learning, although the name wasn't used until 1909. In 1936, Theodore Paul Wright described the effect of learning on production costs in the aircraft industry. This form, in which unit cost is plotted against total production, is sometimes called an experience curve.
The familiar expression "a steep learning curve" is intended to mean that the activity is difficult to learn, although a learning curve with a steep start actually represents rapid progress.
In psychology
The first person to describe the learning curve was Hermann Ebbinghaus in 1885. His tests involved memorizing series of nonsense syllables, and recording the success over a number of trials. The translation does not use the term learning curve—but he presents diagrams of learning against trial number. He also notes that the score can decrease, or even oscillate.
The first known use of the term learning curve is from 1909: "Bryan and Harter (6) found in their study of the acquisition of the telegraphic language a learning curve which had the rapid rise at the beginning followed by a period of retardation, and was thus convex to the vertical axis."
Psychologist Arthur Bills gave a more detailed description of learning curves in 1934. He also discussed the properties of different types of learning curves, such as negative acceleration, positive acceleration, plateaus, and ogive curves. (Fig 1)
In economics
In 1936, Theodore Paul Wright described the effect of learning on production costs in the aircraft industry and proposed a mathematical model of the learning curve.
In 1968 Bruce Henderson of the Boston Consulting Group (BCG) generalized the Unit Cost model pioneered by Wright, and specifically used a Power Law, which is sometimes called Henderson's Law. He named this particular version the experience curve. Research by BCG in the 1970s observed experience curve effects for various industries that ranged from 10 to 25 percent.
The economic learning of productivity and efficiency generally follows the same kinds of experience curves and have interesting secondary effects. Efficiency and productivity improvement can be considered as whole organization or industry or economy learning processes, as well as for individuals. The general pattern is of first speeding up and then slowing down, as the practically achievable level of methodology improvement is reached. The effect of reducing local effort and resource use by learning improved methods paradoxically often has the opposite latent effect on the next larger scale system, by facilitating its expansion, or economic growth, as discussed in the Jevons paradox in the 1880s and updated in the Khazzoom-Brookes Postulate in the 1980s.
Examples and mathematical modeling
A learning curve is a plot of the increase of learning (or proficiency) with experience.
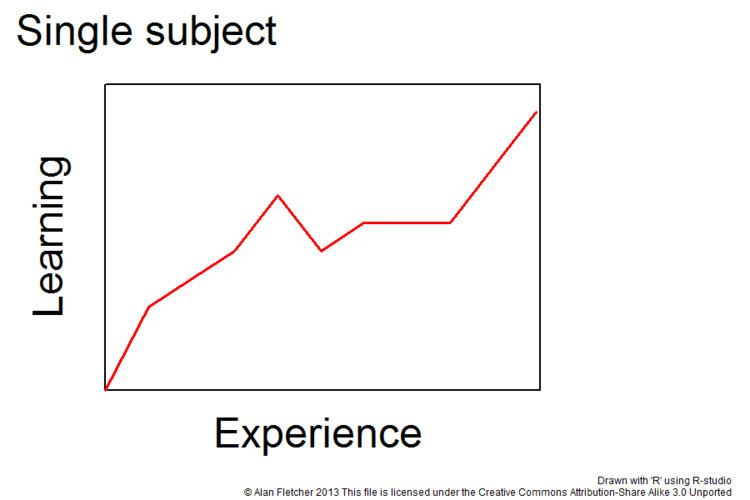
For the performance of one person in a series of trials the curve can be erratic, with proficiency increasing, decreasing or leveling out in a plateau. (Fig 1)
When the results of a large number of individual trials are averaged then a smooth curve results, which can often be described with a mathematical function. (Fig 2)
Several main functions have been used:
The page on "Experience curve effects" offers more discussion of the mathematical theory of representing them as deterministic processes, and provides a good group of empirical examples of how that technique has been applied.
In machine learning
Plots relating performance to experience are widely used in machine learning. Performance is the error rate or accuracy of the learning system, while experience may be the number of training examples used for learning or the number of iterations used in optimizing the system model parameters. The machine learning curve is useful for many purposes including comparing different algorithms, choosing model parameters during design, adjusting optimization to improve convergence, and determining the amount of data used for training.
Broader interpretations
Initially introduced in educational and behavioral psychology, the term has acquired a broader interpretation over time, and expressions such as "experience curve", "improvement curve", "cost improvement curve", "progress curve", "progress function", "startup curve", and "efficiency curve" are often used interchangeably. In economics the subject is rates of "development", as development refers to a whole system learning process with varying rates of progression. Generally speaking all learning displays incremental change over time, but describes an "S" curve which has different appearances depending on the time scale of observation. It has now also become associated with the evolutionary theory of punctuated equilibrium and other kinds of revolutionary change in complex systems generally, relating to innovation, organizational behavior and the management of group learning, among other fields. These processes of rapidly emerging new form appear to take place by complex learning within the systems themselves, which when observable, display curves of changing rates that accelerate and decelerate.
General learning limits
Learning curves, also called experience curves, relate to the much broader subject of natural limits for resources and technologies in general. Such limits generally present themselves as increasing complications that slow the learning of how to do things more efficiently, like the well-known limits of perfecting any process or product or to perfecting measurements. These practical experiences match the predictions of the second law of thermodynamics for the limits of waste reduction generally. Approaching limits of perfecting things to eliminate waste meets geometrically increasing effort to make progress, and provides an environmental measure of all factors seen and unseen changing the learning experience. Perfecting things becomes ever more difficult despite increasing effort despite continuing positive, if ever diminishing, results. The same kind of slowing progress due to complications in learning also appears in the limits of useful technologies and of profitable markets applying to product life cycle management and software development cycles). Remaining market segments or remaining potential efficiencies or efficiencies are found in successively less convenient forms.
Efficiency and development curves typically follow a two-phase process of first bigger steps corresponding to finding things easier, followed by smaller steps of finding things more difficult. It reflects bursts of learning following breakthroughs that make learning easier followed by meeting constraints that make learning ever harder, perhaps toward a point of cessation.
"Steep learning curve"
The expression steep learning curve is used with opposite meanings. Most sources, including the Oxford English Dictionary, the American Heritage Dictionary of the English Language, and Merriam-Webster’s Collegiate Dictionary, define a learning curve as the rate at which skill is acquired, so a steep increase would mean a quick increment of skill. However, the term is often used in common English with the meaning of a difficult initial learning process.
Arguably, the common English use is due to metaphorical interpretation of the curve as a hill to climb. (A steeper hill is initially hard, while a gentle slope is less strainful, though sometimes rather tedious. Accordingly, the shape of the curve (hill) may not indicate the total amount of work required. Instead, it can be understood as a matter of preference related to ambition, personality and learning style.)
The term learning curve with meanings of easy and difficult can be described with adjectives like short and long rather than steep and shallow. If two products have similar functionality then the one with a "steep" curve is probably better, because it can be learned in a shorter time. (Fig 9) On the other hand, if two products have different functionality, then one with a short curve (a short time to learn) and limited functionality may not be as good as one with a long curve (a long time to learn) and greater functionality. (Fig 10)
For example, the Windows program Notepad is extremely simple to learn, but offers little after this. At the other extreme is the UNIX terminal editor vi or Vim, which is difficult to learn, but offers a wide array of features after the user has learned how to use it.
"ON a steep learning curve"
Ben Zimmer discusses the use of the term "ON a steep learning curve" in an article "A Steep Learning Curve" for Downton Abbey, concentrating mainly on whether it is an anachronism. "Matthew Crawley, the presumptive heir of Downton Abbey and now the co-owner of the estate, says, 'I've been on a steep learning curve since arriving at Downton.' By this he means that he's had a difficult time learning the ways of Downton. Unfortunately, people didn't start talking that way until the 1970s."
Zimmer also comments that the popular use of steep as difficult is a reversal of the technical meaning. He identifies the first use of steep learning curve as 1973, and the arduous interpretation as 1978.