
 | ||
The net capacity factor is the unitless ratio of an actual electrical energy output over a given period of time to the maximum possible electrical energy output over the same amount of time. The capacity factor is defined for any electricity producing installation, i.e. a fuel consuming power plant or one using renewable energy, such as wind or the sun. The capacity factor is thus defined also for any class of such installations, and can be used to compare different types of electricity production. The maximum possible energy output of a given installation assumes its continuous operation at full nameplate capacity over the relevant period of time. The actual energy output over the same period of time and with it the capacity factor varies greatly depending on a range of factors. As such, the capacity factor can never exceed the availability factor, i.e. the fraction of downtime due to for example reliability issues and maintenance both scheduled and unscheduled. Other factors include the design of the installation, its location, the overall type of electricity production and with it either the fuel being used or for renewable energy the local weather conditions. Additionally, the capacity factor can be subject to regulatory constraints and market forces potentially affecting both its fuel purchase and its electricity sale.
Contents
- Nuclear power plant
- Wind farm
- Hydroelectric dam
- Photovoltaic power station
- Reasons for reduced capacity factor
- Load following power plants
- Capacity factor and renewable energy
- United States
- United Kingdom
- References
To gain insight into seasonal fluctuations the capacity factor can be computed on a monthly basis, see the illustration. Otherwise it is often computed over a timescale of a year averaging out most temporal fluctuations. Alternatively, it be computed over the lifetime of the power source, both while operational and after decommissioning.
The capacity factor has some relation to but is different from the capacity credit (firm capacity), efficiency or cost of energy.
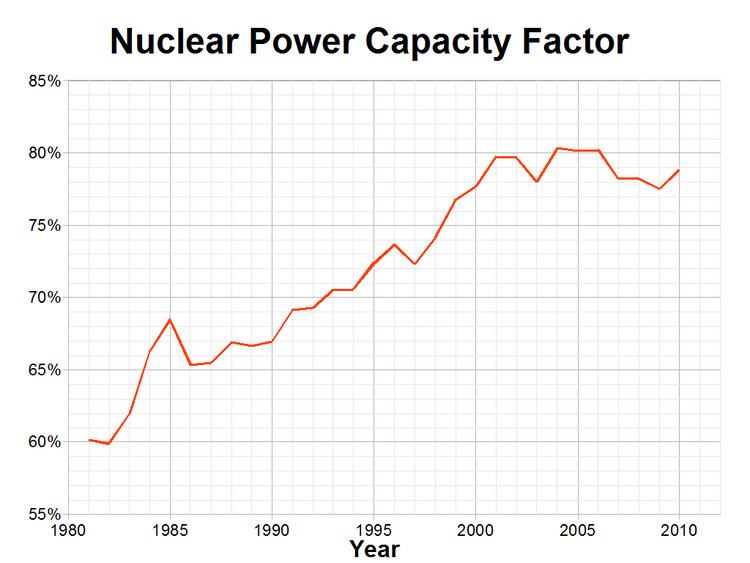
Nuclear power plant
Nuclear power plants are at the high end of the range of capacity factors, ideally reduced only by the availability factor, i.e. maintenance and refueling. The largest nuclear plant in the US, Palo Verde Nuclear Generating Station has between its three reactors a nameplate capacity of 3,942 MW. As of 2010 its annual generation was 31,200,000 MWh, leading to a capacity factor of
Each of Palo Verde’s three reactors is refueled every 18 months, with one refueling every spring and fall. In 2014, a refueling was completed in a record 28 days, compared to the 35 days of downtime that the 2010 capacity factor corresponds to.
Wind farm
The Danish offshore wind farm Horns Rev 2, the world's largest at its inauguration in 2009, has a nameplate capacity of 209.3 MW.
As of January 2017 it has since its commissioning 7.3 years ago produced 6416 GWh, i.e. an average annual production of 875 GWh/year and a capacity factor of
Sites with lower capacity factors may be deemed feasible for wind farms, for example the onshore 1 GW Fosen Vind which as of 2017 is under construction in Norway has a projected capacity factor of 39%.
Certain onshore wind farms can reach capacity factors of over 60%, for example the 44 MW Eolo plant in Nicaragua had a net generation of 232.132 MWh in 2015, equivalent to a capacity factor of 60.2%.
Since the capacity factor of a wind turbine measures actual production relative to possible production it is not constrained by Betz's coefficient of 16/27
Hydroelectric dam
As of 2017 the Three Gorges Dam in China is with its nameplate capacity of 22,500 MW the largest power generating station in the world by installed capacity. In 2015 it generated 87 TWh, for a capacity factor of
Hoover Dam has a nameplate capacity of 2080 MW and an annual generation averaging 4.2 TW·h. (The annual generation has varied between a high of 10.348 TW·h in 1984, and a low of 2.648 TW·h in 1956.) Taking the average figure for annual generation gives a capacity factor of:
Photovoltaic power station
At the low range of capacity factors is the photovoltaic power station, which supplies power to the electricity grid from a large-scale photovoltaic system (PV system). An inherent limit to its capacity factor comes from its requirement of daylight, preferably with a sun unobstructed by clouds, smoke or smog, shade from trees and building structures. Since the amount of sunlight varies both with the time of the day and the seasons of the year, the capacity factor is typically computed on an annual basis. The amount of available sunlight is mostly determined by the latitude of the installation, but also influenced by local factors, such as indirect light reflected from a nearby body of water. The actual production is also influenced by local factors such as dust and ambient temperature, which ideally should be low. As for any power station, the maximum possible power production is the nameplate capacity times the number of hours in a year, while the actual production is the amount of electricity delivered annually to the grid.
For example, Agua Caliente Solar Project, located in Arizona near the 33rd parallel and awarded for its excellence in renewable energy has a nameplate capacity of 290 MW and an actual, average annual production of 740 GWh/year.
Its capacity factor is thus:
A significantly lower capacity factor is achieved by Lauingen Energy Park located in Bavaria near the 49th parallel, with a nameplate capacity of 25.7 MW and an actual, average annual production of 26.98 GWh/year for a capacity factor of 12.0%.
Reasons for reduced capacity factor
There are several reasons why a plant would have a capacity factor lower than 100%. The first reason is that it was out of service or operating at reduced output for part of the time due to equipment failures or routine maintenance. This accounts for most of the unused capacity of base load power plants. Base load plants have the lowest costs per unit of electricity because they are designed for maximum efficiency and are operated continuously at high output. Geothermal plants, nuclear plants, coal-fired plants and bioenergy plants that burn solid material are almost always operated as base load plants.
The second reason that a plant would have a capacity factor lower than 100% is that output is curtailed or intentionally left idle because the electricity is not needed or because the price of electricity is too low to make production economical. This accounts for most of the unused capacity of peaking power plants. Peaking plants may operate for only a few hours per year or up to several hours per day. Their electricity is relatively expensive. Many other power plants operate only at certain times of the day or times of the year because of variation in loads and electricity prices. If a plant is only needed during the day, for example, even if it operates at full power output from 8 am to 8 pm every day all year long, it would only have a 50% Capacity factor, e.g.
A third reason is that a plant may not have the fuel available to operate all of the time. This can apply to fossil generating stations with restricted fuels supplies, but most notably applies to intermittent renewable resources. When the sun isn't shining, solar PV cannot produce electricity. When the wind is not blowing, wind turbines cannot produce electricity. Solar PV and wind turbines have a capacity factor limited by the availability of their "fuel", sunshine and wind respectively.
A hydroelectricity plant may have a capacity factor lower than 100% due to scarcity of water. However, its output may also simply be regulated to match the current power need, conserving its stored water for later usage. A hydroelectricity plant may also be designed for reverse usage so it can pump water up in its reservoir in situations with a power surplus. In both cases the use of the hydroelectricity plant to stabilize the grid reduces its capacity factor. Hydroelectricity may have a higher capacity factor with respect to the turbine size since in some case the amount of stored water fluctuates to account for intermittent availability of water.
Other reasons that a power plant may not have a capacity factor of 100% include restrictions or limitations on air permits and limitations on transmission that force the plant to curtail output.
Load following power plants
Load following power plants, also called intermediate power plants, are between base load and peaking plants in terms of capacity factor, efficiency and cost per unit of electricity. They produce most of their electricity during the day, when prices and demand are highest. However, the demand and price of electricity is far lower during the night and intermediate plants shutdown or reduce their output to low levels overnight.
Capacity factor and renewable energy
When it comes to several renewable energy sources such as solar power, wind power and hydroelectricity, there is a fourth reason for unused capacity. The plant may be capable of producing electricity, but its "fuel" (wind, sunlight or water) may not be available. A hydroelectric plant's production may also be affected by requirements to keep the water level from getting too high or low and to provide water for fish downstream. However, solar, wind and hydroelectric plants do have high availability factors, so when they have fuel available, they are almost always able to produce electricity.
When hydroelectric plants have water available, they are also useful for load following, because of their high dispatchability. A typical hydroelectric plant's operators can bring it from a stopped condition to full power in just a few minutes.
Wind farms are variable, due to the natural variability of the wind. For a wind farm, the capacity factor is mostly determined by the availability of wind. Transmission line capacity and electricity demand also affect the capacity factor. Typical capacity factors of current wind farms are between 25 and 45%, though current 110 meter towers can have up to 55% capacity factor, and future 140 meter towers are expected to have up to 65% capacity factor.
Solar energy is variable because of the daily rotation of the earth, seasonal changes, and because of cloud cover. According to, the Sacramento Municipal Utility District observed a 15% capacity factor in 2005. However, according to the SolarPACES programme of the International Energy Agency (IEA), solar power plants designed for solar-only generation are well matched to summer noon peak loads in areas with significant cooling demands, such as Spain or the south-western United States, although in some locations solar PV does not reduce the need for generation of network upgrades given that air conditioner peak demand often occurs in the late afternoon or early evening when solar output is reduced. SolarPACES states that by using thermal energy storage systems the operating periods of solar thermal power (CSP) stations can be extended to become dispatchable (load following). The IEA CSP Technology Roadmap (2010) suggests that "in the sunniest countries, CSP can be expected to become a competitive source of bulk power in peak and intermediate loads by 2020, and of base-load power by 2025 to 2030". A dispatchable source is more valuable than baseload power.
Geothermal has a higher capacity factor than many other power sources, and geothermal resources are available 24 hours a day, 7 days a week. While the carrier medium for geothermal electricity (water) must be properly managed, the source of geothermal energy, the Earth's heat, will be available for the foreseeable future. Geothermal power can be looked at as a nuclear battery where the heat is produced via the decay of radioactive elements in the core and mantle of the earth.
United States
According to the US Energy Information Administration (EIA), in 2009 the capacity factors were as follows:
However, these values often vary significantly by month.
United Kingdom
The following figures were collected by the Department of Energy and Climate Change on the capacity factors for various types of plants in UK grid: