
 | ||
Solar power in the United States includes utility-scale solar power plants as well as local distributed generation, mostly from rooftop photovoltaics. As of the end of 2016, the U.S. had 40 gigawatts (GW) of installed photovoltaic capacity, having almost doubled in capacity from the previous year. In the twelve months through December 2016, utility scale solar power generated 36.8 terawatt-hours (TWh), 0.90% of total U.S. electricity. During the same time period total solar generation, including estimated distributed solar photovoltaic generation, was 56.2 TWh, 1.38 % of total U.S. electricity. In terms of total installed capacity, by year end 2015 the USA ranked 4th in the world behind China, Germany, and Japan. In 2016, 39% of all new electricity generation capacity in the country came from solar, more than any other source and ahead of natural gas (29%). By 2015, solar employment had overtaken oil and gas as well as coal employment in the U.S.
Contents
- Availability
- Growth
- History
- Selected list of plants
- Prospects
- Cell makers
- Large scale PV facilities
- Planned PV plants
- 2012 priority proposals
- Distributed generation
- Incentives
- Federal
- Section 1603 grants
- Solar America Initiative
- SunShot Initiative
- State and local
- Feed in Tariff
- Solar Renewable Energy Certificates
- Power Purchase Agreement
- New construction mandates
- PACE
- Capacity
- Generation PV and CSP
- Top 15 US States for Solar Capacity
- Congressional investigation
- References
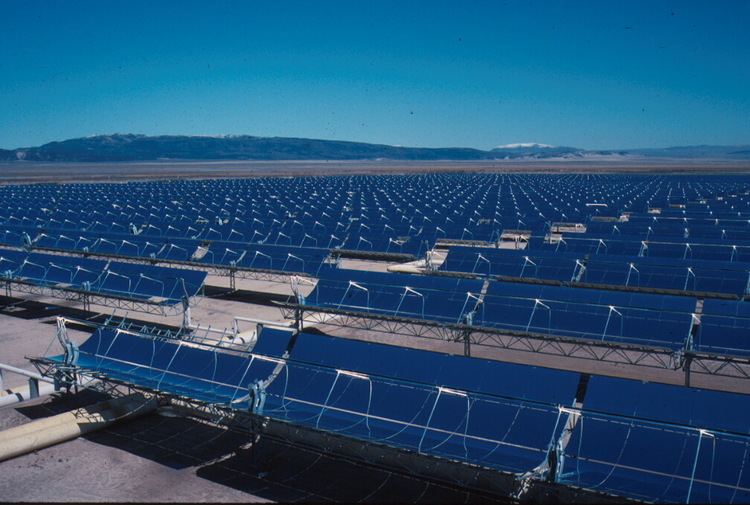
The United States conducted much early research in photovoltaics and concentrated solar power. The U.S. is among the top countries in the world in electricity generated by the Sun and several of the world's largest utility-scale installations are located in the desert Southwest. The oldest solar power plant in the world is the 354-megawatt (MW) SEGS thermal power plant, in California. The Ivanpah Solar Electric Generating System is a solar thermal power project in the California Mojave Desert, 40 miles (64 km) southwest of Las Vegas, with a gross capacity of 392 MW. The 280 MW Solana Generating Station is a solar power plant near Gila Bend, Arizona, about 70 miles (110 km) southwest of Phoenix, completed in 2013. When commissioned it was the largest parabolic trough plant in the world and the first U.S. solar plant with molten salt thermal energy storage.
There are plans to build many other large solar plants in the United States. Many states have set individual renewable energy goals with solar power being included in various proportions. Governor Jerry Brown has signed legislation requiring California's utilities to obtain 33 percent of their electricity from renewable energy sources by the end of 2020.
Availability
A 1997 report by the United States Department of Energy found available domestic solar energy (including biomass) technically accessible regardless of cost amounted to 586,687 Quadrillion BTUs (Quads); 95% of this was biomass. Coal represented the second largest resource, a distant 38,147 Quads. Predictions of how much solar power was economically feasible to collect amounted to 352 quads, compared with 5,266 quads from coal. The assumptions used in the report were based on a predicted 2010 price of a barrel of oil being $38, and multiplied annual renewable resources by 30 for comparison with non-renewable resources. The total annual energy consumption of the United States in 2007 was approximately 100 Quads, less than 0.5% of what is theoretically available from sunlight.
A 2012 report from the National Renewable Energy Laboratory described technically available renewable energy resources for each state and estimated that urban utility scale photovoltaics could supply 2,232 TWh/year, rural utility scale PV 280,613 TWh/year, rooftop PV 818 TWh/year, and CSP 116,146 TWh/year, for a total of almost 400,000 TWh/year, 100 times current consumption of 3,856 TWh in 2011. Onshore wind potential is estimated at 32,784 TWh/year, and offshore wind at 16,976 TWh/year. The total available from all renewable resources is estimated at 481,963 TWh/year.
Growth
Solar energy deployment increased at a record pace in the United States and throughout the world in 2008, according to industry reports. The Solar Energy Industries Association's "2008 U.S. Solar Industry Year in Review" found that U.S. solar energy capacity increased by 17% in 2007, reaching the total equivalent of 8,775 megawatts (MW). The SEIA report tallies all types of solar energy, and in 2007 the United States installed 342 MW of solar photovoltaic (PV) electric power, 139 thermal megawatts (MWth) of solar water heating, 762 MWth of pool heating, and 21 MWth of solar space heating and cooling.
A report finds that solar power's contribution could grow to 10% of the nation's power needs by 2025:
"The report, prepared by research and publishing firm Clean Edge and the nonprofit Co-op America, projects nearly 2% of the nation's electricity coming from concentrating solar power systems, while solar photovoltaic systems will provide more than 8% of the nation's electricity. Those figures correlate to nearly 50,000 megawatts of solar photovoltaic systems and more than 6,600 megawatts of concentrating solar power."As noted in the report, solar power has been expanding rapidly in the past eight years, growing at an average pace of 40% per year. The cost per kilowatt-hour of solar photovoltaic systems has also been dropping, while electricity generated from fossil fuels is becoming more expensive. As a result, the report projects that solar power will reach cost parity with conventional power sources in many U.S. markets by 2015. But to reach the 10% goal, solar photovoltaic companies will also need to streamline installations and make solar power a "plug-and-play" technology, that is, it must be simple and straightforward to buy the components of the system, connect them together, and connect the system to the power grid."The report also places some of the responsibility with electric utilities, which will need to take advantage of the benefits of solar power, incorporate it into future "smart grid" technologies, and create new business models for building solar power capacity. The report also calls for establishing long-term extensions of today's investment and production tax credits, creating open standards for connecting solar power systems to the grid, and giving utilities the ability to include solar power in their rate base."According to a study by the Solar Energy Industries Association and GTM Research, 878 megawatts (MW) of photovoltaic (PV) capacity and 78 MW of concentrating solar power (CSP) were installed in the U.S. in 2010, enough to power roughly 200,000 homes. In addition, more than 65,000 homes and businesses added solar water heating (SWH) or solar pool heating (SPH) systems. This was double the 435 MW installed in 2009 around the U.S.
According to a 2011 survey conducted by independent polling firm Kelton Research, nine out of 10 Americans support the use and development of solar technology. Eight out of 10 respondents indicated that "the federal government should support solar manufacturing in the U.S. and should give federal subsidies for solar energy". According to the Energy Information Administration, in fiscal year 2013, federal supports and subsidies for solar power amounted to $4.4 billion, over 27% of all federal supports and subsidies for electricity production. This figure does not include state and local spending.
Solar Energy Industries Association and GTM Research found that the amount of new solar electric capacity increased in 2012 by 76 percent from 2011, raising the United States’ market share of the world’s installations above 10 percent, up from roughly 5 to 7 percent in the last seven years.
According to the U.S. Energy Information Administration, as of September 2014 utility-scale solar had sent 12,303 gigawatt-hours of electricity to the U.S. grid. This was an increase of over 100% versus the same period in 2013 (6,048 GWh).
The number of homes with solar systems installed has been increasing rapidly; from 30,000 in 2006 to 400,000 in 2013 with a study by the U.S. Department of Energy predicting the figure could reach 3,800,000 homes by 2020.
Utilities in the United States have led a largely unsuccessful campaign to slow the growth of solar.
History
One of the first applications of concentrated solar was the 6 hp solar powered motor made by H.E. Willsie and John Boyle in 1904.
An early solar pioneer of the 19th and 20th century, Frank Shuman, built a demonstration plant that used solar power to pump water using an array of mirrors in a trough to generate steam. Located in Philadelphia, the solar water pump station was capable of pumping 3000 gallons an hour (25 hp) at that latitude. After seven weeks of testing the plant was disassembled and shipped to Egypt for testing as an irrigation plant.
In 1973, Karl Böer of the University of Delaware built an experimental house called the Solar One, the first house to convert sunlight into energy.
Solar One, the first pilot solar power tower design was completed in 1981. The parabolic trough Solar Energy Generating Systems opened its first unit in 1984, the first major solar thermal plant in the world.
Selected list of plants
The U.S. pioneered solar tower and trough technologies. A number of different solar thermal technologies are in use in the U.S:
The rapidly falling price of PV solar had led to several projects being abandoned or converted to PV technology. Blythe Solar Power Project converted to a PV project, Rice Solar Energy Project was put on indefinite hold, Palen Solar Project tried to convert to PV but its permits were denied, Hidden Hills Solar Project was suspended in 2013 and later canceled. No major CSP plants remain under construction in the United States.
Prospects
In 2012, 3,313 megawatts of photovoltaics were installed, which amounts to a 76% growth over 2011's total installed base of 4,383 MW, which itself was a 73% increase over 2010's installed base of 2,528 MW. In 2013, total installations increased another 41%, adding 4,751 MW to reach a total of 12,100 MW.
Current trends indicate that a large number of photovoltaic power plants will be built in the south and southwest areas, where there is ample land in the sunny deserts of California, Nevada and Arizona. Large properties are being bought there with the aim of building more utility-scale PV power plants. In addition, many of the projects are on BLM public land.
Cell makers
New manufacturing facilities for solar cells and modules in Massachusetts, Michigan, New York, Ohio, Oregon, and Texas promise to add enough capacity to produce thousands of megawatts of solar devices per year within the next few years. Some of these include:
Large-scale PV facilities
The ten largest solar PV plants in the U.S. are:
Other operational PV power plants include:
Planned PV plants
Over 30 GW of utility-scale photovoltaic power plants were under development in the United States in 2015. The largest is the 2,700 MW Westlands Solar Park, in Kings County, California. The Blythe Solar Power Project is a 485 MW photovoltaic station under construction in Riverside County, California. The 300 MW Sonoran Solar Project in Arizona, is a photovoltaic solar power plant that is being planned by a subsidiary of NextEra Energy Resources. Secretary of the Interior Ken Salazar granted approval for the project in December 2011.
SolarStrong is SolarCity's five-year plan to build more than $1 billion in solar photovoltaic projects for privatized military housing communities across the United States. SolarCity plans to work with the country's leading privatized military housing developers to install, own and operate rooftop solar installations and provide solar electricity at a lower cost than utility power. SolarStrong is ultimately expected to create up to 300 megawatts of solar generation capacity that could provide power to as many as 120,000 military housing units, making it the largest residential photovoltaic project in American history. In November 2011, SolarCity and Bank of America Merrill Lynch announced that they have agreed to terms on financing for SolarStrong.
2012 priority proposals
In 2012, the Bureau of Land Management is giving priority status to 9 PV project proposals. The 750 MW McCoy Solar Project has been proposed by NextEra. The 100 MW Desert Harvest project has been proposed by enXco. The 664 Calico Solar Project has been redesigned by K Power. The 350 MW Silver State South and 350 MW Moapa project have been proposed. The 600 MW Mount Signal Solar Farm #1 has also been proposed.
Prior to 2012, in six southwestern states (Arizona, California, Colorado, Nevada, New Mexico, and Utah) the US Bureau of Land Management owned nearly 98 million acres (an area larger than the state of Montana) that was open to proposals for solar power installations. To streamline consideration of applications, the BLM produced a Programmatic Environmental Impact Statement (PEIS). By the subsequent Record of Decision in October 2012, the BLM withdrew 78 percent of its land from possible solar development, leaving 19 million acres still open to applications for solar installations, an area nearly as large as South Carolina. Of the area left open to solar proposals, the BLM has identified 285 thousand acres in 17 highly favorable areas it calls Solar Energy Zones.
Total: 42,554 MW - 76,577 MW, depending on the technology used
Distributed generation
Within the cumulative PV capacity in the U.S., there has been growth in the distributed generation segment, which are all grid-connected PV installations in the residential and non-residential markets. Non-residential market includes installations on commercial, government, school and non-profit organization properties. Between 2000 and 2013 there had been 2,261 MW of residential solar and 4,051 MW non-residential solar installed. In 2013, there were 1,913 MW installed for these markets; the top 5 states were California, New Jersey, Massachusetts, Hawaii, and Arizona. The residential market had 60% annual growth in 2013. The growth contributing factors were new marketing strategies to partner with retailers to reach more customers, and new financial models including the securitization of residential solar assets. Non-residential PV had a slight growth of 4% in 2013 as the market was recovering from the oversupply in 2012. The future growth will likely come from New York, Arizona, and Colorado.
One of the largest residential solar projects was a 115 kilowatt system on a property in Southern California in 2011. There were many large scale non-residential installations. One of the largest rooftop installations for commercial properties was the 9 MW system of Holt Logistics refrigerated warehouse at the Gloucester Marine Terminal in New Jersey. One of the large scale PV installations in schools was the solar project of San Diego Unified School District with total of 48 sites and aggregated installed capacity of 9.17 MW.
Another type of distributed generation implemented by utility company is the world's first grid-connected pole-attached solar panels of Public Service Enterprise Group in New Jersey. More than 174,000 PV panels are mounted on utility poles along streets of New Jersey with aggregated capacity of 40 MW.
Incentives
A complete list of incentives is maintained at the Database of State Incentives for Renewable Energy (DSIRE) (see external link).
Most are grid connected and use net metering laws to allow use of electricity in the evening that was generated during the daytime. New Jersey leads the nation with the least restrictive net metering law, while California leads in total number of homes which have solar panels installed. Many were installed because of the million solar roof initiative.
Federal
The federal tax credit for solar was extended for eight years as part of the financial bail out bill, H.R. 1424, until the end of 2016. It was estimated this will create 440,000 jobs, 28 gigawatts of solar power, and lead to a $300 billion market for solar panels. This estimate did not take into account the removal of the $2,000 cap on residential tax credits at the end of 2008.
A 30% tax credit is available for residential and commercial installations. For 2009 through 2011 this was a 30% grant, not a tax credit, known as the 1603 grant program.
The federal Residential Energy Efficient Property Credit (income tax credit on IRS Form 5695) for residential PV and solar thermal was extended in December 2015 to remain at 30% of system cost (parts and installation) for systems put into service by the end of 2019, then 26% until the end of 2020, and then 22% until the end of 2021. It applies to a taxpayer's principal and/or second residences, but not to a property that is rented out. There is no maximum cap on the credit, and the credit can be applied toward the Alternative Minimum Tax, and any excess credit (greater than that year's tax liability) can be rolled into the following year.
The solar industry and utilities clashed extensively on renewal, but the solar industry prevailed. The renewal is expected to add $38 billion of investment for 20 GigaWatts of solar.
Section 1603 grants
President Obama’s stimulus bill in 2009 created a program known as Section 1603 grants. The program was designed to give federal grants to solar companies for 30 percent of investments into solar energy. Since 2009, the federal government has given solar companies $25 billion in grant money through this program. The Section 1603 grant program expired in 2011.
The United States Treasury Department has been investigating solar companies for potential fraud since 2013. The department promised a report by June 2015, but a release of such a report has not yet occurred as of April 2016.
Congressional investigators, led by U.S. Senators Jeff Flake and Lisa Murkowski, wrote a letter in early March 2016 to the Inspector General’s office of the Treasury Department. The letter asked the office to give Congress an update on the investigations and cited the department’s own statements saying that Section 1603 applicants might have claimed $1.3 billion in “unwarranted cash grants.”
On June 9, 2016, Senator Orrin Hatch requested from Department of Treasury, the Internal Revenue Service (IRS) and the Treasury Inspector General for Tax Administration (TIGTA) details about how companies use Section 1603 grants and tax credits. In March 2016, Hatch asked the IRS and Treasury Department to demonstrate that the agencies use safeguards and coordinate with each other when reviewing applications for Section 1603 grants.
Solar America Initiative
The United States Department of Energy (DOE) announced on September 29, 2008 that it will invest $17.6 million, subject to annual appropriations, in six company-led, early-stage photovoltaic (PV) projects under the Solar America Initiative's "PV Incubator" funding opportunity. The "PV Incubator" project is designed to fund prototype PV components and systems with the goal of moving them through the commercialization process by 2010. The 2008 award is the second funding opportunity released under the PV Incubator project. With the cost share from industry, which will be at least 20%, up to $35.4 million will be invested in these projects. The projects will run for 18 months, and will be subcontracted through DOE's National Renewable Energy Laboratory.
Most of the projects were to receive up to $3 million in funding, with the exception of Solasta and Spire Semiconductor, which would receive up to $2.6 million and $2.97 million, respectively. Massachusetts-based 1366 Technologies will develop a new cell architecture for low-cost, multi-crystalline silicon cells, which will enhance cell performance through improved light-trapping texturing and grooves for self-aligned metallization fingers. California's Innovalight will use ink-jet printing to transfer their "silicon ink" onto thin-crystalline silicon wafers to produce high-efficiency, low-cost solar cells and modules. Skyline Solar, also in California, will develop an integrated, lightweight, single-axis tracked system that reflects and concentrates sunlight over 10 times onto silicon cells. Solasta, in Massachusetts, is working on a novel cell design that increases currents and lowers the materials cost. Solexel, another California-based company, will commercialize a disruptive, 3D high-efficiency mono-crystalline silicon cell technology that dramatically reduces manufacturing cost per watt. Finally, Spire Semiconductor in New Hampshire will develop three-junction tandem solar cells that better optimize the optical properties of their device layers; the company is targeting cell efficiencies over 42% using a low-cost manufacturing method.
The PV Incubator project is part of the Solar America Initiative, which aims to make solar energy cost-competitive with conventional forms of electricity by 2015 (grid parity).
The U.S. Department of Energy Solar Energy Technology Program (SETP) will achieve the goals of the SAI through partnerships and strategic alliances by focusing primarily on four areas:
The Solar America Showcases activity is part of the Solar America Initiative (SAI), and preference is given to large-scale, highly visible, highly replicable installations that involve cutting-edge solar technologies or novel applications of solar.
SunShot Initiative
The SunShot Initiative was announced by the Department of Energy and aims to reduce the cost of solar power by 75% from 2010 to 2020. The name is based on "moon shot", Kennedy's target of reaching the moon within the decade.
Goals:
The Energy Department on December 7 announced a $29 million investment in four projects that will help advance affordable, reliable clean energy for U.S. families and businesses. The $29 million would be separated into two investments:
Fraunhofer USA’s Center for Sustainable Energy Systems in Cambridge, Massachusetts, will develop PV technologies that allow homeowners to easily select the right solar system for their house and install, wire and connect to the grid.
North Carolina State University will lead a project to create standard PV components and system designs that can adapt simply to any residential roof and can be installed and connected to the grid quickly and efficiently.
IBM Thomas J. Watson Research Center in Armonk, New York, will lead a new project based on the Watson computer system that uses big data processing and self-adjusting algorithms to integrate different prediction models and learning technologies.
These projects are working with the Energy Department and the National Oceanic and Atmospheric Association to improve the accuracy of solar forecasts and share the results of this work with industry and academia.
State and local
Feed-in Tariff
Experience has demonstrated that a feed-in tariff is both the least expensive and the most effective means of developing solar power. Investors need certainty, which they receive from a feed-in tariff. California enacted a feed-in tariff which began on February 14, 2008. Washington state has a feed-in tariff of 15 ¢/kWh which increases to 54 ¢/kWh if components are manufactured in the state. Hawaii, Michigan, and Vermont also have feed in tariffs.
In 2010, the Federal Energy Regulatory Commission (FERC) ruled that states were able to implement above-market feed-in tariffs for specific technologies.
Solar Renewable Energy Certificates
In recent years, states that have passed Renewable Portfolio Standard (RPS) or Renewable Electricity Standard (RES) laws have relied on the use of Solar renewable energy certificates (SRECs) to meet state requirements. This is done by adding a specific solar carve-out to the state Renewable Portfolio Standard (RPS). The first SREC program was implemented in 2005 by the state of New Jersey and has since expanded to several other states, including Maryland, Delaware, Ohio, Massachusetts, North Carolina and Pennsylvania.
An SREC program is an alternative to the feed-in tariff model popular in Europe. The key difference between the two models is the market-based mechanism that drives the value of the SRECs, and therefore the value of the subsidy for solar. In a feed-in tariff model, the government sets the value for the electricity produced by a solar facility. If the level is higher, more solar power is built and the program is more costly. If the feed-in tariff is set lower, less solar power is built and the program is ineffective. The problem with SRECs is a lack of certainty for investors. A feed-in tariff provides a known return on investment, while an SREC program provides a possible return on investment.
Power Purchase Agreement
In 2006 investors began offering free solar panel installation in return for a 25-year contract, or Power Purchase Agreement, to purchase electricity at a fixed price, normally set at or below current electric rates. By 2009 over 90% of commercial photovoltaics installed in the United States were installed using a power purchase agreement. Approximately 90% of the photovoltaics installed in the United States is in states that specifically address power purchase agreements.
New construction mandates
In March 2013, Lancaster California became the first U.S. city to mandate the inclusion of solar panels on new homes, requiring that "every new housing development must average 1 kilowatt per house."
PACE
An innovative financing arrangement pioneered in Berkeley, California, and Palm Springs, lends money to a homeowner for a solar system, to be repaid via an additional tax assessment on the property for 20 years. This allows installation of the solar system at "relatively little up-front cost to the property owner." Now known as PACE, for Property Assessed Clean Energy, it is available in 28 states. Freddie Mac and Fannie Mae have objected to the repayment of solar loans being senior to mortgage loans, and some states have relegated PACE loans to junior loans. HR 2599 was introduced to prevent interference with the PACE program by other lenders. The principle feature of the program is that the balance of the loan is transferred to the new owners in the event the property is sold, and the loan is paid for entirely through electric bill savings. Unlike a mortgage loan, no funds are transferred when the property is sold - only the repayment obligation is transferred.
PACE programs are currently operating in eight states, California, Colorado, Florida, Maine, Michigan, Missouri, New York, and Wisconsin, and are on hold in many others, pending resolution of the Freddie Mac, Fannie Mae objection.
Capacity
In the United States, 2,106 MW of PV was installed in the 4th quarter and 4,751 MW of PV installations were completed in 2013. Abengoa's 280 MWac of CSP project was brought online in the 3rd quarter and Genesis Solar's first phase of 125 MWac was brought online in the 4th quarter of 2013 bringing the total to 410 MWac for the year and 918 MWac total. Ivanpah is already completed during the first quarter of 2014 the current world's largest CSP power plant is 392 MWac and brings the total to 1310 MWac. The 110 MWac Crescent Dunes project started commissioning during February. The 250 MWac Mojave solar, second phase 125 MWac Genesis Solar, and Tooele Army Depot Solar's 1.5 MWac power plant are all expected to come online in 2014. The A total of around 9.5 GW of solar PV and CSP capacity is expected to come on-line in 2016, more than any other source.
The amount of electricity a unit is capable of producing over an extended period of time is determined by multiplying the capacity by the capacity factor. The capacity factor for solar photovoltaic units is largely a function of climate and latitude. The National Renewable Energy Laboratory has calculated that the highest statewide average solar voltaic capacity factors are in Arizona, New Mexico, and Nevada (each 26.3 percent), and the lowest is Alaska (10.5 percent). The lowest statewide average capacity factor in the contiguous 48 states is in West Virginia (17.2 percent).
Generation (PV and CSP)
Source: NREL EIA.
NREL includes distributed generation, EIA, including the monthly data above, includes only utility generation. "EIA % of total" is the percent of all electricity produced that is generated by utility solar.
Top 15 US States for Solar Capacity
As of 2016 these are the top US states by MW of deployed solar generation capacity. Source: NREL
Congressional investigation
On September 14, 2016, the Senate Finance Committee and the House Ways and Means Committee expanded on a formal investigation into the billions of dollars in tax incentives that solar-energy companies received. The investigation also focused on whether the Obama administration improperly gave out solar tax credits. Committee investigators sent official letters to seven domestic and foreign solar industry companies, which include the following: three firms in the residential solar industry, (SolarCity, Sunrun, and Sungevity) and four solar utility companies (SunEdison, Abengoa, NextEra Energy and NRG Energy).
The investigational probe was led by Senator Orrin Hatch (R-Utah), the chairman of the Senate Finance Committee, and U.S. Representative Kevin Brady (R-Texas), the chairman of the Ways and Means Committee. Committee investigators reviewed the use of tax incentives for solar power companies and their third-party financing. According to Utility Dive, "Solar advocates last year pressed for the extension of the tax credit, maintaining it was necessary to level the playing field against more established technologies, and to help push forward with greenhouse gas reduction goals."
In early 2016, Sen. Hatch began examining the nearly $25 billion in cash grants that "green energy" firms have accumulated during the course of the Obama Administration. Hatch concluded that the Internal Revenue Service and the Treasury Department do not have adequate controls over the program. According to the Wall Street Journal, "The green energy tax program was launched in 2009 as part of President Barack Obama’s plan to stimulate the U.S. economy and promote investments in renewable energy in the aftermath of the financial crisis."