UCSF Chimera (or simply Chimera) is an extensible program for interactive visualization and analysis of molecular structures and related data, including density maps, supramolecular assemblies, sequence alignments, docking results, trajectories, and conformational ensembles. High-quality images and movies can be created. Chimera includes complete documentation and can be downloaded free of charge for noncommercial use.
Chimera is developed by the Resource for Biocomputing, Visualization, and Informatics (RBVI) at the University of California, San Francisco. Development is funded by the National Institutes of Health (NIGMS grant P41-GM103311). The next-generation program UCSF ChimeraX is under development.
automatic identification of atom typeshydrogen addition and partial charge assignmenthigh-quality hydrogen bond, contact, and clash detectionmeasurements: distances, angles, surface area, volumecalculation of centroids, axes, planes and associated measurementsamino acid rotamer libraries, protein Ramachandran plot, protein contact mapstructure building and bond rotationmolecular dynamics trajectory playback (many formats), distance and angle plotsmorphing between conformations of a protein or even different proteinsdisplay of attributes (B-factor, hydrophobicity, etc.) with colors, radii, "worms"easy creation of custom attributes with simple text file inputsViewDock tool to facilitate interactive screening of docking resultsrich set of commands, powerful specification syntaxmany formats read, PDB and Mol2 writtenWeb and fetch from Protein Data Bank, CATH or SCOP (domains), EDS (density maps), EMDB (density maps), ModBase (comparative models), CASTp (protein pocket measurements), Pub3D (small molecule structures), VIPERdb (icosahedral virus capsids), UniProt (protein sequences with feature annotations), othersinterfaces to PDB2PQR charge/radius assignment, APBS electrostatics calculations, AutoDock Vina single-ligand dockingPresentation images and movies
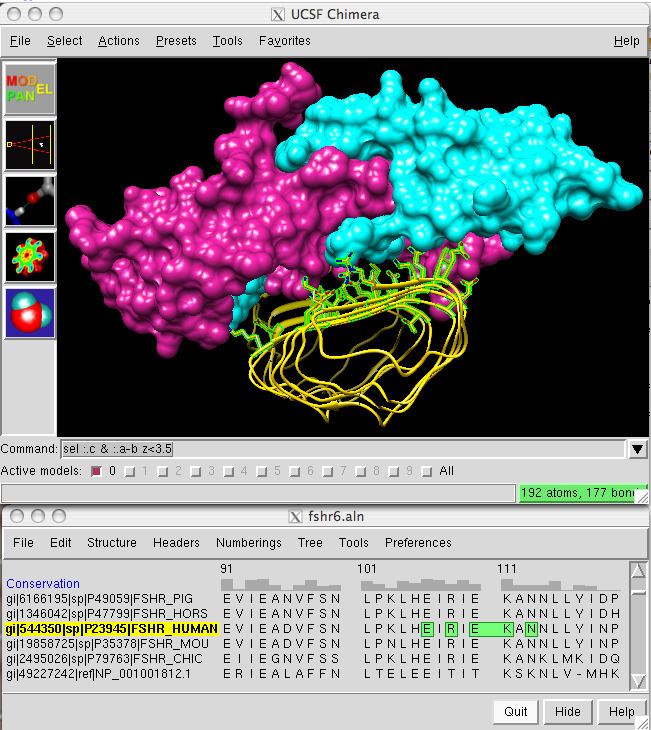
high-resolution imagesvisual effects including depth-cueing, interactive shadows, silhouette edges, multicolor backgroundsstandard molecular representations (sticks, spheres, ribbons, molecular surfaces)pipes-and-planks for helices and strands; nucleotide objects including lollipops and ladder rungsellipsoids to show anisotropic B-factorsnonmolecular geometric objectsrenderings of density maps and other volume data (see below)labeling with text, symbols, arrows, color keysdifferent structures can be clipped differently and at any angleoptional raytracing with bundled POV-Rayscene export to X3D and other formatssimple graphical interface for creating movies interactivelyscenes can be placed as keyframes along an animation timelinealternatively, movie content and recording can be scripted; rich set of related commandsmovie recording is integrated with morphing and MD trajectory playbackmany formats of volume data maps (electron density, electrostatic potential, others) read, several writteninteractive threshold adjustment, multiple isosurfaces (mesh or solid), transparent renderingsfitting of atomic coordinates to maps and maps to mapsdensity maps can be created from atomic coordinatesmarkers can be placed in maps and connected with smooth pathsdisplay of individual data planes or multiple orthogonal planesvolume data time series playback and morphingmany tools for segmenting and editing mapsGaussian smoothing, Fourier transform, other filtering and normalizationmeasurements: surface area, surface-enclosed volume, map symmetry, othersmany sequence alignment formats read, writtensequence alignments can be created, editedsequences automatically associate with structuressequence-structure crosstalk: highlighting in one highlights the otherprotein BLAST search via Web servicemultiple sequence alignment via Clustal Omega and MUSCLE Web servicesinterfaces to MODELLER for homology modeling and loop buildingstructure superposition with or without pre-existing sequence alignmentgeneration of structure-based sequence alignments from multiple superpositionsseveral methods for calculating conservation and displaying values on associated structuresRMSD header (histogram above the sequences) showing spatial variability of associated structuresuser-defined headers including histograms and colored symbolsUniProt and CDD feature annotations shown as colored boxes on sequencestrees in Newick format read/displayedUCSF ChimeraX (or simply ChimeraX) is the next-generation molecular visualization program from the Resource for Biocomputing, Visualization, and Informatics (RBVI) at the University of California, San Francisco, following UCSF Chimera. It is in early development. Prerelease daily builds with current (basic) capabilities are available for Mac, Linux, and Windows from the UCSF ChimeraX website, along with documentation and other information. Development is funded by the National Institutes of Health (NIGMS grant P41-GM103311).