
 | ||
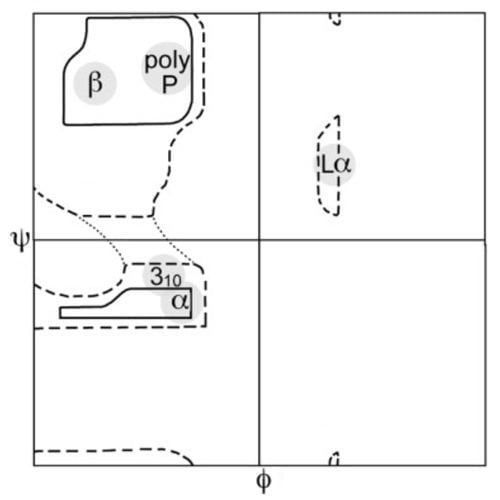
A Ramachandran plot (also known as a Ramachandran diagram or a [φ,ψ] plot), originally developed in 1963 by G. N. Ramachandran, C. Ramakrishnan, and V. Sasisekharan, is a way to visualize energetically allowed regions for backbone dihedral angles ψ against φ of amino acid residues in protein structure. The figure at left illustrates the definition of the φ and ψ backbone dihedral angles (called φ and φ' by Ramachandran). The ω angle at the peptide bond is normally 180°, since the partial-double-bond character keeps the peptide planar. The figure at top right shows the allowed φ,ψ backbone conformational regions from the Ramachandran et al. 1963 and 1968 hard-sphere calculations: full radius in solid outline, reduced radius in dashed, and relaxed tau (N-Cα-C) angle in dotted lines. Because dihedral angle values are circular and 0° is the same as 360°, the edges of the Ramachandran plot "wrap" right-to-left and bottom-to-top. For instance, the small strip of allowed values along the lower-left edge of the plot are a continuation of the large, extended-chain region at upper left.
Contents
Uses
A Ramachandran plot can be used in two somewhat different ways. One is to show in theory which values, or conformations, of the ψ and φ angles are possible for an amino-acid residue in a protein (as at top right). A second is to show the empirical distribution of datapoints observed in a single structure (as at right, here) in usage for structure validation, or else in a database of many structures (as in the lower 3 plots at left). Either case is usually shown against outlines for the theoretically favored regions.
More recent updates
The first Ramachandran plot was calculated just after the first protein structure at atomic resolution was determined (myoglobin, in 1960), although the conclusions were based on small-molecule crystallography of short peptides. Now, many decades later, there are tens of thousands of high-resolution protein structures determined by X-ray crystallography and deposited in the Protein Data Bank (PDB). Many studies have taken advantage of this data to produce more detailed and accurate φ,ψ plots (e.g., Morris et al. 1992; Kleywegt & Jones 1996; Hooft et al. 1997; Hovmöller et al. 2002; Lovell et al. 2003; Anderson et al. 2005. Ting et al. 2010).
The three figures below show the datapoints from a large set of high-resolution structures and contours for favored and for allowed conformational regions for the general case (all amino acids except Gly, Pro, and pre-Pro), for Gly, and for Pro. The most common regions are labeled: α for α helix, Lα for lefthanded helix, β for β-sheet, and ppII for polyproline II.
The Molecular Biophysics Unit at Indian Institute of Science celebrated 50 years of Ramachandran Map by organizing International Conference on Biomolecular Forms and Functions from 8–11 January 2013.
Related conventions
One can also plot the dihedral angles in polysaccharides (e.g. with CARP;) and other polymers in this fashion. For the first two protein side-chain dihedral angles a similar plot is the Janin Plot.
Software
See also PDB for a list of similar software.