Kalpana Kalpana (Editor)

Timeline of the 2015 Atlantic hurricane season

Updated on
Edit
Like
Comment
Share on FacebookTweet on TwitterShare on LinkedInShare on Reddit
Timeline of the 2015 Atlantic hurricane season

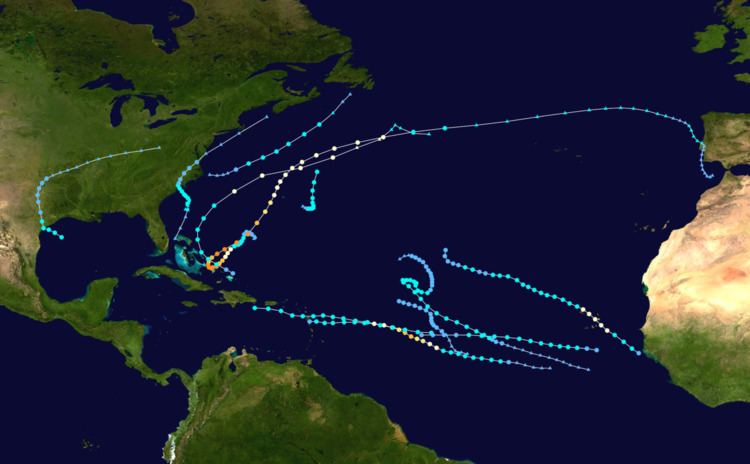
The 2015 Atlantic hurricane season was the third consecutive year to feature below-average activity, with eleven named storms. The season began on June 1 and ended on November 30, dates adopted by convention that historically describe the period in each year when most tropical cyclones form in the Atlantic basin. The season's first storm, Tropical Storm Ana, developed on May 8; the season's final storm, Hurricane Kate, lost its tropical characteristics on November 11.

Contents

The year featured twelve tropical cyclones, of which eleven intensified into tropical storms and four further intensified into hurricanes (including two major hurricanes). Several storms caused generally minor damage throughout the season. In May, Ana moved ashore the coastline of South Carolina, becoming the earliest landfalling tropical storm on record in the United States and causing two fatalities. In June, the precursor to Tropical Storm Bill caused significant flooding across Central America before the cyclone made landfall in Texas; overall, eight people were killed. In July, Tropical Storm Claudette caused minor impacts along the East Coast of the United States and Newfoundland. In August, Hurricane Danny and Tropical Storm Erika affected the Lesser Antilles and Greater Antilles; the latter caused significant damage and killed 36 people. In August, Hurricane Fred prompted the first-ever issuance of a hurricane warning in Cape Verde. The following month, Hurricane Joaquin – one of the most intense cyclones to affect the Bahamas in recorded history – caused widespread and significant damage to the island country while contributing to historic flooding across the Southeastern United States. In November, Kate impacted the Bahamas; its remnants caused minor damage across the United Kingdom.

This timeline includes information that was not operationally released, meaning that data from post-storm reviews by the National Hurricane Center, such as a storm that was not operationally warned upon, has been included. This timeline documents tropical cyclone formations, strengthening, weakening, landfalls, extratropical transitions, and dissipations during the season.

May

May 8

  • 00:00 UTC (8:00 p.m. EDT, May 7) – Subtropical Storm Ana develops from an area of low pressure about 175 mi (280 km) south-southeast of Myrtle Beach, South Carolina.
  • May 9

  • 00:00 UTC (8:00 p.m. EDT, May 8) – Subtropical Storm Ana attains its peak intensity with maximum sustained winds of 60 mph (95 km/h) and a minimum barometric pressure of 998 mb (hPa; 29.47 inHg) roughly 150 mi (240 km) southeast of Myrtle Beach, South Carolina.
  • 06:00 UTC (2:00 a.m. EDT) – Subtropical Storm Ana transitions into a fully tropical cyclone about 130 mi (210 km) southeast of Myrtle Beach, South Carolina.
  • May 10

  • 10:00 UTC (6:00 a.m. EDT) – Tropical Storm Ana makes landfall near North Myrtle Beach, South Carolina with winds of 60 mph (95 km/h), becoming the earliest United States landfalling tropical cyclone on record.
  • 18:00 UTC (2:00 p.m. EDT) – Tropical Storm Ana weakens to a tropical depression roughly 45 mi (75 km) west-southwest of Wilmington, North Carolina.
  • May 12

  • 00:00 UTC (8:00 p.m. EDT, May 11) – Tropical Depression Ana degenerates into a non-convective remnant area of low pressure about 15 mi (25 km) south of Ocean City, Maryland.
  • June

    June 1

  • The 2015 Atlantic hurricane season officially begins.
  • June 16

  • 00:00 UTC (7:00 p.m. CDT, June 15) – Tropical Storm Bill develops from an area of low pressure about 200 mi (320 km) east-southeast of Corpus Christi, Texas.
  • 12:00 UTC (7:00 a.m. CDT) – Tropical Storm Bill attains its peak intensity with maximum sustained winds of 60 mph (95 km/h) and a minimum barometric pressure of 997 mb (hPa; 29.44 inHg) roughly 85 miles (140 km) east-northeast of Corpus Christi, Texas.
  • 16:45 UTC (11:45 a.m. CDT) – Tropical Storm Bill makes landfall on Matagorda Island, Texas, with winds of 60 mph (95 km/h).
  • June 17

  • 06:00 UTC (1:00 a.m. CDT) – Tropical Storm Bill weakens to a tropical depression about 35 mi (55 km) east of Austin, Texas.
  • June 18

  • 18:00 UTC (1:00 p.m. CDT) – Tropical Depression Bill degenerates into a non-convective remnant area of low pressure roughly 75 mi (120 km) south-southeast of Tulsa, Oklahoma.
  • July

    July 13

  • 06:00 UTC (2:00 a.m. AST) – A tropical depression develops from an area of low pressure about 280 mi (450 km) east-southeast of Virginia Beach, Virginia.
  • 12:00 UTC (8:00 a.m. AST) – The tropical depression intensifies into Tropical Storm Claudette roughly 330 mi (530 km) southeast of Ocean City, New Jersey.
  • 18:00 UTC (2:00 p.m. AST) – Tropical Storm Claudette attains its peak intensity with maximum sustained winds of 50 mph (85 km/h) and a minimum barometric pressure of 1003 mb (hPa; 29.62 inHg) about 410 mi (660 km) southeast of New York, New York.
  • July 15

  • 00:00 UTC (8:00 p.m. AST, July 14) – Tropical Storm Claudette degenerates into a non-convective remnant area of low pressure roughly 245 mi (395 km) south-southwest of Saint-Pierre, Newfoundland.
  • August

    August 18

  • 06:00 UTC (2:00 a.m. AST) – Tropical Depression Four develops from an area of low pressure roughly 740 mi (1,190 km) southwest of Brava, Cape Verde.
  • 12:00 UTC (8:00 a.m. AST) – Tropical Depression Four intensifies into Tropical Storm Danny approximately 810 mi (1,305 km) southwest of Brava, Cape Verde.
  • August 20

  • 12:00 UTC (8:00 a.m. AST) – Tropical Storm Danny intensifies into a Category 1 hurricane about 1,095 mi (1,760 km) east of the Barbados.
  • August 21

  • 00:00 UTC (8:00 p.m. AST, August 20) – Hurricane Danny intensifies into a Category 2 hurricane roughly 900 mi (1,450 km) east of Barbados.
  • 12:00 UTC (8:00 a.m. AST) – Hurricane Danny intensifies into a Category 3 hurricane and simultaneously attains its peak intensity with maximum sustained winds of 125 mph (205 km/h) and a minimum barometric pressure of 960 mb (hPa; 28.35 inHg) approximately 790 mi (1,270 km) east of Barbados.
  • August 22

  • 00:00 UTC (8:00 p.m. AST, August 21) – Hurricane Danny weakens to a Category 2 hurricane about 690 mi (1,110 km) east of Barbados.
  • 12:00 UTC (8:00 a.m. AST) – Hurricane Danny weakens to a Category 1 hurricane roughly 565 mi (910 km) east-northeast of Barbados.
  • August 23

  • 00:00 UTC (8:00 p.m. AST, August 22) – Hurricane Danny weakens to a tropical storm approximately 405 mi (650 km) northeast of Barbados.
  • August 24

  • 12:00 UTC (8:00 a.m. AST) – Tropical Storm Danny weakens to a tropical depression about 15 mi (25 km) north of Dominica.
  • 18:00 UTC (2:00 p.m. AST) – Tropical Depression Danny degenerates into a trough of low pressure over the extreme northeastern Caribbean Sea.
  • August 25

  • 03:00 UTC (11:00 p.m. AST August 24) – Tropical Storm Erika develops from an area of low pressure about 955 mi (1,535 km) east of the Leeward Islands.
  • August 27

  • 09:00 UTC (5:00 a.m. AST) – Tropical Storm Erika attains its peak intensity with maximum sustained winds of 50 mph (85 km/h) and a minimum barometric pressure of 1003 mb (hPa; 29.63 inHg) roughly 35 mi (55 km) north of Guadeloupe.
  • August 29

  • 13:30 UTC (9:30 a.m. EDT) – Tropical Storm Erika degenerates into a trough of low pressure about 130 mi (205 km) east of Camagüey, Cuba.
  • August 30

  • 00:00 UTC (8:00 p.m. AST, August 29) – Tropical Depression Six develops from an area of low pressure roughly 300 mi (485 km) west-northwest of Conakry, Africa.
  • 06:00 UTC (2:00 a.m. AST) – Tropical Depression Six intensifies into Tropical Storm Fred approximately 370 mi (595 km) northwest of Conakry, Africa.
  • August 31

  • 00:00 UTC (8:00 p.m. AST, August 30) – Tropical Storm Fred intensifies into a Category 1 hurricane about 165 mi (265 km) south-southeast of Sal, Cape Verde.
  • 12:00 UTC (8:00 a.m. AST) – Hurricane Fred attains its peak intensity with maximum sustained winds of 85 mph (140 km/h) and a minimum barometric pressure of 986 mb (hPa; 29.12 inHg) roughly 50 mi (85 km) south-southwest of Sal, Cape Verde.
  • September

    September 1

  • 06:00 UTC (2:00 a.m. AST) – Hurricane Fred weakens to a tropical storm about 55 mi (90 km) north-northwest of Santo Antão, Cape Verde.
  • September 4

  • 12:00 UTC (8:00 a.m. AST) – Tropical Storm Fred weakens to a tropical depression roughly 1,245 mi (2,005 km) southwest of the Azores.
  • September 5

  • 00:00 UTC (8:00 p.m. AST, September 4) – Tropical Depression Fred re-intensifies into a tropical storm about 1,265 mi (2,035 km) southwest of the Azores.
  • 06:00 UTC (2:00 a.m. AST) – Tropical Depression Seven develops from an area of low pressure roughly 175 mi (280 km) south of the Cape Verde Islands.
  • 12:00 UTC (8:00 a.m. AST) – Tropical Storm Fred weakens to a tropical depression for a second time about 1,295 mi (2,085 km) southwest of the Azores.
  • 18:00 UTC (2:00 p.m. AST) – Tropical Depression Seven intensifies into Tropical Storm Grace about 185 mi (300 km) south-southwest of the Cape Verde Islands.
  • September 6

  • 12:00 UTC (8:00 a.m. AST) – Tropical Storm Grace attains its peak intensity with maximum sustained winds of 60 mph (95 km/h) and a minimum barometric pressure of 1000 mb (hPa; 29.53 inHg) roughly 335 mi (540 km) southwest of the Cape Verde Islands.
  • 18:00 UTC (2:00 p.m. AST) – Tropical Depression Fred degenerates into a trough of low pressure approximately 1,210 mi (1,945 km) southwest of the Azores.
  • September 8

  • 12:00 UTC (8:00 a.m. AST) – Tropical Storm Grace weakens to a tropical depression roughly 1,150 mi (1,850 km) west of the Cape Verde Islands.
  • 18:00 UTC (2:00 p.m. AST) – Tropical Depression Eight develops from an area of low pressure roughly 215 mi (345 km) southeast of Bermuda.
  • September 9

  • 00:00 UTC (8:00 p.m. AST, September 8) – Tropical Depression Eight intensifies into Tropical Storm Henri about 220 mi (355 km) southeast of Bermuda.
  • 12:00 UTC (8:00 a.m. AST) – Tropical Depression Grace degenerates into a trough about 750 mi (1,205 km) east of the Lesser Antilles.
  • 18:00 UTC (2:00 p.m. AST) – Tropical Storm Henri attains its peak intensity with maximum sustained winds of 50 mph (85 km/h) and a minimum barometric pressure of 1003 mb (hPa; 29.62 inHg) roughly 250 mi (400 km) east-southeast of Bermuda.
  • September 11

  • 12:00 UTC (8:00 a.m. AST) – Tropical Storm Henri degenerates into a trough well north of Bermuda.
  • September 16

  • 12:00 UTC (8:00 a.m. AST) – Tropical Depression Nine develops from an area of low pressure roughly 1,265 mi (2,035 km) west of the Cape Verde Islands.
  • September 17

  • 06:00 UTC (2:00 a.m. AST) – Tropical Depression Nine attains its peak intensity with maximum sustained winds of 35 mph (55 km/h) and a minimum barometric pressure of 1006 mb (hPa; 29.71 inHg) about 1,060 mi (1,705 km) east of the Lesser Antilles.
  • September 18

  • 06:00 UTC (2:00 a.m. AST) – Tropical Depression Ten develops from an area of low pressure roughly 750 mi (1,205 km) west of the southernmost Cape Verde Islands.
  • September 19

  • 00:00 UTC (8:00 p.m. AST, September 18) – Tropical Depression Ten intensifies into Tropical Storm Ida about 845 mi (1,360 km) west-southwest of the southernmost Cape Verde Islands.
  • 18:00 UTC (2:00 p.m. AST) – Tropical Depression Nine dissipates roughly 805 mi (1,295 km) east of the northern Leeward Islands.
  • September 21

  • 06:00 UTC (2:00 a.m. AST) – Tropical Storm Ida attains maximum sustained winds of 50 mph (85 km/h) about 950 mi (1,530 km) northeast of the northern Lesser Antilles.
  • 12:00 UTC (8:00 a.m. AST) – Tropical Storm Ida attains a minimum barometric pressure of 1001 mb (hPa; 29.56 inHg) roughly 910 mi (1,465 km) northeast of the northern Lesser Antilles.
  • September 24

  • 06:00 UTC (2:00 a.m. AST) – Tropical Storm Ida weakens to a tropical depression roughly 1,060 mi (1,705 km) east-northeast of the northern Lesser Antilles.
  • September 27

  • 12:00 UTC (8:00 a.m. AST) – Tropical Depression Ida degenerates into a non-convective remnant area of low pressure about 1,235 mi (1,990 km) northeast of San Juan, Puerto Rico.
  • September 28

  • 00:00 UTC (8:00 p.m. AST, September 27) – Tropical Depression Eleven develops from an area of low pressure roughly 415 mi (670 km) northeast of San Salvador Island, Bahamas.
  • September 29

  • 00:00 UTC (8:00 p.m. EDT, September 28) – Tropical Depression Eleven intensifies into Tropical Storm Joaquin about 340 mi (545 km) northeast of San Salvador Island, Bahamas.
  • September 30

  • 06:00 UTC (2:00 a.m. EDT) – Tropical Storm Joaquin intensifies into a Category 1 hurricane roughly 195 mi (315 km) east-northeast of San Salvador Island, Bahamas.
  • October

    October 1

  • 00:00 UTC (8:00 p.m. EDT, September 30) – Hurricane Joaquin intensifies into a Category 3 hurricane about 105 mi (165 km) east of San Salvador Island, Bahamas.
  • 12:00 UTC (8:00 a.m. EDT) – Hurricane Joaquin intensifies into a Category 4 hurricane and makes its first landfall on Samana Cay, Bahamas, with winds of 135 mph (215 km/h).
  • October 2

  • 00:00 UTC (8:00 p.m. EDT, October 1) – Hurricane Joaquin attains a minimum barometric pressure of 931 mb (hPa; 27.50 inHg) roughly 5 mi (10 km) northwest of Crooked Island, Bahamas.
  • 16:00 UTC (12:00 p.m. EDT) – Hurricane Joaquin weakens to a Category 3 hurricane and makes its second landfall on Rum Cay, Bahamas, with winds of 125 mph (205 km/h).
  • 21:00 UTC (5:00 p.m. EDT) – Hurricane Joaquin makes its third landfall on San Salvador Islands, Bahamas, with winds of 125 mph (205 km/h).
  • October 3

  • 00:00 UTC (8:00 p.m. EDT, October 2) – Hurricane Joaquin re-intensifies into a Category 4 hurricane about 15 mi (35 km) north-northeast of San Salvador Island, Bahamas.
  • 12:00 UTC (8:00 a.m. EDT) – Hurricane Joaquin attains its peak intensity with maximum sustained winds of 155 mph (250 km/h) roughly 145 mi (235 km) northeast of San Salvador Island, Bahamas.
  • October 4

  • 06:00 UTC (2:00 a.m. EDT) – Hurricane Joaquin weakens to a Category 3 hurricane about 310 mi (500 km) south-southwest of Bermuda.
  • 12:00 UTC (8:00 a.m. EDT) – Hurricane Joaquin weakens to a Category 2 hurricane roughly 190 mi (305 km) south-southwest of Bermuda.
  • October 5

  • 00:00 UTC (8:00 p.m. EDT, October 4) – Hurricane Joaquin weakens to a Category 1 hurricane about 70 mi (110 km) west-northwest of Bermuda.
  • October 7

  • 12:00 UTC (8:00 a.m. EDT) – Hurricane Joaquin weakens to a tropical storm roughly 480 mi (770 km) southeast of Cape Race, Newfoundland.
  • October 8

  • 00:00 UTC (8:00 p.m. EDT, October 7) – Tropical Storm Joaquin transitions into a extratropical storm about 445 mi (715 km) west-northwest of the Azores.
  • November

    November 8

  • 18:00 UTC (1:00 p.m. EST) – Tropical Depression Twelve develops from an area of low pressure about 55 mi (90 km) north-northwest of Cockburn Town, Turks and Caicos Islands.
  • November 9

  • 06:00 UTC (1:00 a.m. EST) – Tropical Depression Twelve intensifies into Tropical Storm Kate roughly 50 mi (85 km) north of Crooked Island, Bahamas.
  • November 11

  • 00:00 UTC (7:00 p.m. EST, November 10) – Tropical Storm Kate intensifies into a Category 1 hurricane about 390 mi (630 km) east-southeast of Wilmington, North Carolina.
  • 12:00 UTC (7:00 a.m. AST) – Hurricane Kate attains its peak intensity with maximum sustained winds of 85 mph (140 km/h) and a minimum barometric pressure of 980 mb (hPa; 28.94 inHg) roughly 320 mi (515 km) northeast of Bermuda.
  • November 12

  • 00:00 UTC (7:00 p.m. AST, November 11) – Hurricane Kate transitions into an extratropical cyclone about 735 mi (1,185 km) northeast of Bermuda.
  • November 30

  • The 2015 Atlantic hurricane season officially ends.
  • References

    Timeline of the 2015 Atlantic hurricane season Wikipedia