
 | ||
The RNA integrity number (RIN) is an algorithm for assigning integrity values to RNA measurements.
Contents
The integrity of RNA is a major concern for gene expression studies and traditionally has been evaluated using the 28S to 18S rRNA ratio, a method that has been shown to be inconsistent. This inconsistency arises because subjective, human interpretation is necessary to compare the 28S and 18S gel images. The RIN algorithm was devised to overcome this issue. The RIN algorithm is applied to electrophoretic RNA measurements, typically obtained using capillary gel electrophoresis, and based on a combination of different features that contribute information about the RNA integrity to provide a more universal measure. RIN has been demonstrated to be robust and reproducible in studies comparing it to other RNA integrity calculation algorithms, cementing its position as a preferred method of determining the quality of RNA to be analyzed.
A major criticism to RIN is when using with plants or in studies of eukaryotic-prokaryotic cells interactions. The RIN algorithm is unable to differentiate eukaryotic/prokaryotic/chloroplastic ribosomal RNA, creating serious quality index underestimation in such situations.
Terminology
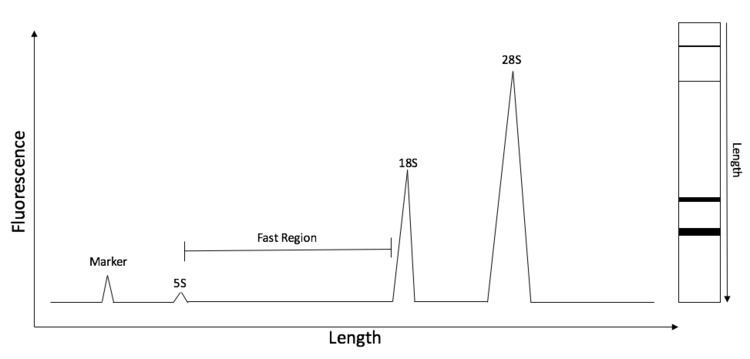
Electrophoresis is the process of separating nucleic acid species based on their length by applying an electric field to them. As nucleic acids are negatively charged, they are pushed by an electric field through a matrix, usually an agarose gel, with the smaller molecules being pushed farther, faster. Capillary electrophoresis is a technique whereby small amounts of a nucleic acid sample can be run on a gel in a very thin tube. There is a detector in the machine that can tell when nucleic acid samples pass through a detector, with smaller samples passing through first. This can produce an electropherogram such as the one in Figure 1, where length is related to time at which the samples pass this detector.
A marker is a sample of known size run along with the sample so that the actual size of the rest of the sample can be known by comparing their running distance/time to be relative to this marker.
RNA is a biological macromolecule made of sugars and nitrogenous bases that plays a number of crucial roles in all living cells. There are several subtypes of RNA, with the most prominent in the cell being tRNA (transfer RNA), rRNA (ribosomal RNA), and mRNA (messenger RNA). All three of these are involved in the process of translation, with the most prominent species (~85%) of cellular RNA being rRNA. As a result, this is the most immediately visible species when RNA is analyzed via electrophoresis and is thus used for determining RNA quality (see Computation, below). rRNA comes in various sizes, with those in mammals belonging to the sizes 5S, 18S, and 28S. The 28S and 5S rRNAs form the large subunit and the 18S forms the small subunit of the ribosome, the molecular machinery responsible for synthesizing proteins.
Applications
RNases are ubiquitous and can often contaminate and subsequently degrade RNA samples in the laboratory, so RNA integrity can very easily be compromised, leading to a number of laboratory techniques designed to eliminate their impact. However, these methods are not full-proof, and so samples can still be degraded, necessitating a method of measuring RNA integrity to ensure the trustworthiness and reproducibility of molecular assays, as RNA integrity is critical for proper results in gene expression studies, such as microarray analysis, Northern blots, or quantitative real-time PCR (qPCR). RNA that has been degraded has a direct impact on calculated expression levels, often leading to significantly decreased apparent expression.
qPCR and similar techniques are very expensive, taking a good deal of both time and money, so continuing research being undertaken to decrease the cost while maintaining qPCR's accuracy and reproducibility for gene expression and other applications. RIN assessment allows a scientist to evaluate an experiment’s trustworthiness and reproducibility before incurring substantial costs in performing the gene expression studies.
RIN has become a standard method of measuring integrity, even in meta-analyses such as "Efficient extraction of small and large RNAs in bacteria for excellent total RNA sequencing and comprehensive transcriptome analysis", wherein the authors analyzed a number of different RNA extraction methods, using the resultant RIN as a measure of their efficiency at producing high-quality RNA. RIN has also been used to test the efficiency of other techniques, such as microdissections, on maintaining RNA integrity in human cells, so it has a wide variety of uses in testing the quality of new techniques. RIN has become an industry standard to test various methods for the quality of their produced RNA, and it is also used in a wide variety of non-meta analyses so that the scientists are able to ensure that the quality of their RNA is trustworthy and their results are thus sound, often with a benchmark minimal RIN being used as a standard to ensure all of their RNA is high enough quality to yield reliable findings.
Development
As RNA integrity has long been known to be a problem in molecular biology studies, there are a few methods that have been used historically to determine the integrity of RNA. The most popular has long been agarose gel electrophoresis with ethidium bromide staining, allowing one to visualize the bands from the rRNA peaks. The height of the 28S and 18S bands can be compared to each other, with a 2:1 ratio indicating non-degraded RNA. While this method is very cheap and easy, there are several issues with this method, primarily its subjectivity, leading to inconsistent, non-standardized RNA quality assessments, and the large amounts of RNA that are needed to visualize it on an agarose gel, which can be problematic if there is not much RNA to work with. There are also a number of different problems that can arise from agarose gel electrophoresis, such as poor loading, uneven running, and uneven staining that lead to increased variability in the accuracy of using agarose gel electrophoresis to determine RNA integrity. Clearly, a standardized, repeatable, objective method of determining RNA integrity was clearly needed.
Agilent Technologies sought to create one, and so created the RNA Integrity Number. The algorithm was generated by taking hundreds of samples and having specialists manually assign them all a value of 1 to 10 based on their integrity, with 10 being the highest. Adaptive learning tools using a Bayesian learning technique were used to generate an algorithm that could predict the RIN, predominantly by using the features listed below under "Computation". This allows for all Agilent software to produce the same RIN for a given RNA sample, standardizing the measurement and making it much less subjective than earlier methods.
Computation
RIN for a sample is computed using several characteristics of an RNA electropherogram trace, with the first two listed below being most significant. RIN assigns an electropherogram a value of 1 to 10, with 10 being the least degraded. All the following descriptions apply to mammalian RNA, as RNAs in other species have different rRNA sizes:
In prokaryotic samples, the algorithm is somewhat different, but the Agilent 2100 Bioanalyzer Expert software is able to calculate RIN for prokaryotic samples now as well. The difference likely arises from the fact that, while mammalian samples have 28S and 18S ribosomal RNAs as their predominant species, prokaryotic RNAs have the sizes shifted slightly smaller, to 23S and 16S, so the algorithm must be shifted to accommodate that. Another crucial fact about calculating prokaryotic RNA integrity numbers is that RIN has not been validated to the extent that it has for eukaryotic RNA. It has been shown that higher RIN values correlate with better downstream results in eukaryotes, but this hasn't been done as extensively for prokaryotes, so it may mean less in prokaryotes.
These electropherograms for calculating RIN are done using the Agilent Bioanalyzer machine, which is capable of performing electrophoresis and generating the electropherograms. The Agilent 2100 software is uniquely able to perform the RIN software, as the exact algorithm is proprietary, so there are additional important RNA electropherogram features that are used in its calculation that are not publicly available.