
 | ||
Ordinal data is a categorical, statistical data type where the variables have natural, ordered categories and the distances between the categories is not known. These data exist on an ordinal scale, one of four levels of measurement described by S. S. Stevens in 1946. The ordinal scale is distinguished from the nominal scale by having ordered categories. It also differs from interval and ratio scales by not having category widths that represent equal increments of the underlying attribute.
Contents
Examples of ordinal data
A well-known example of ordinal data is the Likert scale. An example of a Likert scale is:
Examples of ordinal data are often found in questionnaires: for example, the survey question "Is your general health poor, reasonable, good, or excellent?" may have those answers coded respectively as 1, 2, 3, and 4. Sometimes data on an interval scale or ratio scale are grouped onto an ordinal scale: for example, individuals whose income is known might be grouped into the income categories $0-$19,999, $20,000-$39,999, $40,000-$59,999, ..., which then might be coded as 1, 2, 3, 4, .... Other examples of ordinal data include socioeconomic status, military ranks, and letter grades for coursework.
Ways to analyze ordinal data
Ordinal data analysis requires a different set of analyses than other qualitative variables. These methods incorporate the natural ordering of the variables in order to avoid loss of power. Finding a mean or standard deviation for ordinal data is often discouraged, but other methods such as median or mode should instead be used.
General
Stevens (1946) argued that, because the assumption of equal distance between categories does not hold for ordinal data, the use of means and standard deviations for description of ordinal distributions and of inferential statistics based on means and standard deviations was not appropriate. Instead, medians and percentiles in addition to descriptive statistics appropriate for nominal data (number of cases, mode, contingency correlation) should be used. have been proposed as the most appropriate procedures for inferential statistics involving ordinal data, especially those developed for the analysis of ranked measurements. However, use of parametric statistics for ordinal data may be permissible with certain caveats to take advantage of the greater range of available statistical procedures.
Univariate statistics
In place of means and standard deviations, univariate statistics appropriate for ordinal data include the median, other percentiles (such as quartiles and deciles), and the quartile deviation. One-sample tests for ordinal data include the Kolmogorov-Smirnov one-sample test, the one-sample runs test, and the change-point test.
Bivariate statistics
In lieu of testing differences in means with t-tests, differences in distributions of ordinal data from two independent samples can be tested with Mann-Whitney, runs, Smirnov, and signed-ranks tests. Test for two related or matched samples include the sign test and the Wilcoxon signed ranks test. Analysis of variance with ranks and the Jonckheere test for ordered alternatives can be conducted with ordinal data in place of independent samples ANOVA. Tests for more than two related samples include the Friedman two-way analysis of variance by ranks and the Page test for ordered alternatives. Correlation measures appropriate for two ordinal-scaled variables include Kendall's tau, gamma, rs, and dyx/dxy.
Regression applications
Ordinal data can be considered as a quantitative variable. In logistic regression, the equation
is the model and c takes on the assigned levels of the categorical scale. In regression analysis, outcomes (dependent variables) that are ordinal variables can be predicted using a variant of ordinal regression, such as ordered logit or ordered probit.
In multiple regression/correlation analysis, ordinal data can be accommodated using power polynomials and through normalization of scores and ranks.
Linear trends
Linear trends are also used to find associations between ordinal data and other categorical variables, normally in a contingency tables. A correlation r is found between the variables where r lies between -1 and 1. To test the trend, a test statistic:
is used where n is the sample size.
R can be found by letting
Classification methods
Classification methods have also been developed for ordinal data. The data are divided into different categories such that each observations are similar to each other. Dispersion is measured and minimized in each group to maximize classification results. The dispersion function is used in information theory.
Visualization and display
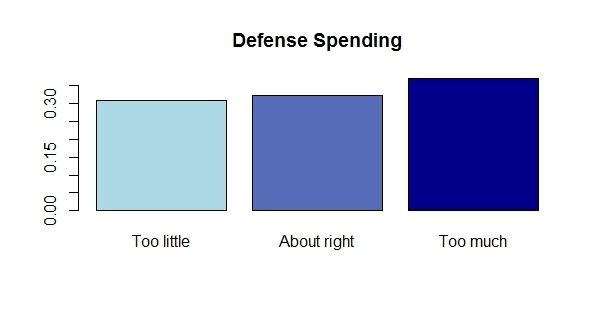
Ordinal data can be visualized in several different ways. Common visualizations are the bar chart or a pie chart. Tables can also be useful for displaying ordinal data and frequencies. Mosaic plots can be used to show the relationship between an ordinal variable and a nominal or ordinal variable. A bump chart—a line chart that shows the relative ranking of items from one time point to the next—is also appropriate for ordinal data.
Color or grayscale gradation can be used to represent the ordered nature of the data. A single-direction scale, such as income ranges, can be represented with a bar chart where increasing (or decreasing) saturation or lightness of a single color indicates higher (or lower) income. The ordinal distribution of a variable measured on a dual-direction scale, such as a Likert scale, could also be illustrated with color in a stacked bar chart. A neutral color (white or gray) might be used for the middle (zero or neutral) point with contrasting colors used in the opposing directions from the midpoint, where increasing saturation or darkness of the colors could indicate categories at increasing distance from the midpoint. Choropleth maps also use color or grayscale shading to display ordinal data.
Applications
The use of ordinal data can be found in most areas of research where categorical data are generated. Settings where ordinal data are often collected include the social and behavioral sciences and governmental and business settings where measurements are collected from persons by observation, testing, or questionnaires. Some common contexts for the collection of ordinal data include survey research; and intelligence, aptitude, and personality testing.