
J F M A M J | F M A M J J | |
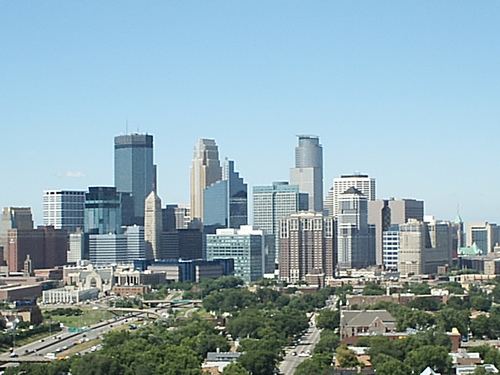 | ||
The climate of Minneapolis–Saint Paul is the long term weather trends and historical events of the Minneapolis–Saint Paul metropolitan area in east central Minnesota. Minneapolis and St. Paul, together known as the Twin Cities, are the core of the 15th largest metropolitan area in the United States. With a population of 3.6 million people, the region contains approximately 60% of the population of Minnesota. Due to its location in the northern and central portion of the U.S., the Twin Cities has the coldest average temperature of any major metropolitan area in the nation. Winters can be cold, summer is warm to hot and frequently humid, snowfall is common in the winter and thunderstorms with heavy rainfall occur during the spring, summer and autumn. Though winter can be cold, the area receives more sunlight hours in mid-winter than many other warmer parts of the country, including all of the Great Lakes states, the Pacific Northwest, parts of the South, and almost all of the Northeast. Unless otherwise indicated, all normals data presented below are based on data at Minneapolis/St. Paul International Airport, the official Twin Cities climatology station, from the 1981−2010 normals period.
Contents
General climatology
The climate of the Twin Cities is classified as humid continental (Köppen Dfa). A feature of the humid continental climate in the United States is that weather can be unpredictable with extremes occurring in many phases of measurements. For example, the Twin Cities has a hotter all-time record high temperature of 108 °F (42 °C) than the entire state of Florida, despite being located nearly 1000 miles farther from the equator. Conversely, temperatures during the winter months are colder in the Twin Cities than in any other major metropolitan area in the continental United States, and are about equal to those in Anchorage, Alaska, which is around 1,000 miles closer to the North Pole. The Twin Cities can also experience droughts, floods, and on average are windier than Chicago, Illinois (the "Windy City", although that is not the origin of the phrase).
Temperature
Because of its location in the center of North America, the Twin Cities region is subjected to some of the widest range of temperatures in the United States. Temperatures in the Twin Cities region range from an average of 15.6 °F (−9.1 °C) in January to 73.8 °F (23.2 °C) in July. With no natural barriers to block cold air from pouring south from Canada, the Twin Cities are subjected to many arctic air masses throughout the winter months. These arctic air masses bring with them cold temperatures and sometimes strong winds. The Twin Cities has a comparable average summer temperatures to other nearby metropolitan areas such as Chicago, but the arctic outbreaks during the winter push the average winter temperature of the Twin Cities below that of Chicago's. Despite being located just 350 miles (563 km) from Chicago, the Twin Cities' average January of temperature of 15.6 °F (−9.1 °C) is below Chicago's 23.8 °F (−4.6 °C). During summer months, Minneapolis can be subject to hot temperatures from May to September, and high humidity.
Records
With temperature records dating to 1 October 1872, the range in temperatures has officially ranged from −30 °F (−34 °C) on January 21, 1888, up to 108 °F (42 °C) on July 14, 1936 during the Dust Bowl years. The coldest daily maximum temperature was −20 °F (−29 °C), set six days before the all-time record low, while the warmest daily minimum was 86 °F (30 °C), again set one day before the all-time record high. The monthly average temperature has ranged from −3.4 °F (−19.7 °C) in January 1875 to 81.4 °F (27.4 °C) in July 1936, while for the annual mean temperature, the range is 38.5 °F (3.6 °C) in 1875 to 50.8 °F (10.4 °C) in 1931 and 2012.
Urban heat island effect
A significant impact on temperatures in the Twin Cities the past several years has been the urban heat island effect. Large amounts of concrete and asphalt, coupled with numerous tall buildings (which block wind) help to trap heat close to the surface, resulting in warmer temperatures, especially at night, than that of the surrounding areas (even those further to the south). For example, the average annual temperature of 45.4 at the Minneapolis St. Paul International airport is warmer than that of Rochester (43.4) and Mankato (44.7) which are both located farther to the south.
Precipitation
The Twin Cities experiences a wide range of precipitation types. Rain is the most common form during the summer months, while snow, sleet, freezing rain, and occasionally rain occur during the winter. The summer months of June, July and August account for nearly half of the annual precipitation total across the Twin Cities. Most of this rain falls from thunderstorms, a frequent summer occurrence. Even though summer is the primary season for the Twin Cities to experience thunderstorms, they can occur from March to November. On rare occasions thundersnow can occur, where thunder and lightning accompanies winter or (more usually) spring snowstorms. During spring and summer, some thunderstorms are severe. These storms produce damaging straight line winds, large hail and, occasionally, a tornado. The Twin Cities has experienced several major derecho events, most recently during the Late-May 1998 Tornado Outbreak and Derecho which traveled from South Dakota to New York on May 30 – May 31, 1998. Summertime thunderstorms are fueled by dew points that often reach into the 70s °F (21 °C) and sometimes even 80 °F (27 °C).
Winter precipitation comes in a few different forms. Snow is the main form of precipitation, but freezing rain, ice, sleet and sometimes even rain are all possible during the winter months. Larger storm systems, often Panhandle hooks or other storms that occur with a meridional flow, can bring large amounts of snow and even blizzard conditions. The average annual snowfall in the Twin Cities is 45.3 inches (115.1 cm), with an average of 100 days per year with at least 1 inch (2.5 cm) of snow cover. The most snow the Twin Cities has officially seen during one winter was in 1983–1984 with 98.4 inches (250 cm), and the least was in 1930–1931 with 14.2 inches (36.1 cm).
Tornadoes
The Twin Cities metropolitan area lies near the northern edge of Tornado Alley, and as such the region experiences tornadoes almost annually. The first recorded tornado observed in the Twin Cities metro area was in 1820 at Fort Snelling. A destructive tornado struck St. Paul in 1891.
The worst tornado event to affect the Twin Cities was on May 6, 1965. On that day, six tornadoes touched down in several counties in and around the western and northern metro area, killing 13 people and injuring over 600. Four of the tornadoes were rated F4, two of which hit Fridley, Minnesota about an hour apart. This outbreak was notable because this was the first time in Minnesota history that civil defense sirens were used to warn people of impending severe weather. The live coverage by the Twin Cities media was also unprecedented. WCCO's continual broadcast of the weather situation is credited with warning people about the tornadoes and saving lives.
In 1981 a twister dubbed the Har-Mar tornado touched down in Minneapolis, proceeding to affect the northern suburbs of the metro area, including killing a man near Lake Harriet. On July 18, 1986 a tornado touched down in Fridley, and video captured from KARE 11 news helicopter was broadcast live on their 5:00 pm newscast. The aerial video captured on that day was unprecedented at the time, and was heavily researched.
On May 25, 2008 an EF3 tornado hit the town of Hugo during the Late-May 2008 tornado outbreak sequence. The twister damaged or destroyed several homes in the town, causing an estimated $25 million in damage.
Derechos
Though derechos do not have winds as strong as tornadoes, they impact larger areas and thus can easily cause just as much damage. The costliest severe weather event in the Twin cities history was a derecho that occurred on May 15, 1998. Large hail and damaging wind caused most of the $1 billion in damages reported. Two weeks later on May 30, another large derecho produced winds of over 80 miles per hour (130 km/h) over a large portion of the Twin Cities metropolitan area. These two events combined to cause $1.5 billion in damage, and they created the largest debris cleanup project in Minnesota history.
Snow
On November 11, 1940 the Armistice Day Blizzard affected all of southeast Minnesota, killing 60 people in Minnesota. The Twin Cities recorded 17 inches of snow, and temperatures dropped nearly sixty degrees over the course of one day. The largest snowstorm to affect most of the Twin Cities area was the Halloween Blizzard on October 31 – November 2, 1991. Officially, 28.4 inches (72 cm) of snow was reported at the Twin Cities airport. The heaviest snow fell in a line from there, northward to Duluth. Lesser amounts fell to the east and west of that line, but it was the largest early-season snowstorm for the entire region.
Floods
The largest flash flood in Twin Cities history occurred on July 23–July 24, 1987. Dubbed locally The Super Storm, more rain fell from this event than any other in recorded Twin Cities history. The storm caused damage to 9,000 homes, killed two people, and caused $27 million in damage. Some areas in the southern metro area recorded 11 inches (279 mm) of rain. The 9.15 inches (232 mm) that fell on July 23 is the largest official single-day rainfall for the Twin Cities. Overall, at least 10 inches (254 mm) of rain fell over 93 square miles (241 km2), and at least 4 inches (100 mm) fell over 1,460 square miles (3,781 km2). This event was voted the eighth most significant weather event in the state of Minnesota during the 20th century. Three days before this event on July 20–July 21, up to 9 inches (230 mm) of rain fell over some of these same areas. These two storms combined to help the Twin Cities to their wettest summer on record, with 23.52 inches (597 mm) of rain falling from June to August.
The Minnesota River and Mississippi River both flow through the Twin Cities, and in turn there is some degree of River flooding almost annually. The worst floods in Twin Cities history on these rivers were in 1965. Other substantial floods occurred in 1969, 1993, 1997 and 2001.