
 | ||
Wind power in New Zealand generates a small but rapidly growing proportion of the country's electricity. Having only become an established generation source in the late 1990s, as of 2016, wind power accounts for 690 MW of installed capacity and nearly 5 percent of electricity generated in the country.
Contents
- Generation capacity and expansion
- Acceptance
- Coping with intermittency
- Summary of wind power generation for 2007
- Availability over a year
- Examples of returns
- Correlation between different locations
- Summary
- List of operating wind farms
- Individual wind turbines
- References
New Zealand is in the path of the Roaring Forties, creating an excellent resource for wind generation. The funnelling effect of Cook Strait and the Manawatu Gorge exacerbate the resource's potential, making the Lower North Island the main region for wind generation - 70 percent of the nation's current installed capacity lies within this region, with some turbines recording over 50 percent capacity factor in this area.
Generation capacity and expansion
As of January 2012, New Zealand had an installed wind generation capacity of 622 MW. In the 2011 calendar year, wind power produced 1,930 GWh of electricity, 4.5 percent of the country's electricity generation that year.
Around 3000 MW of wind farms and turbines have received resource consent or are seeking it.
The New Zealand Wind Energy Association predicts that wind could reach 20 percent of New Zealand's annual generation by 2030
Acceptance
Wind farms and turbines generate a wide range of opinions from outright opposition to widespread acceptance. Opposition is due to noise, aesthetics and ecological factors. A Palmerston North landscape designer launched a petition in 2008 calling for a moratorium on wind farm developments until stricter national policies are in place, including minimum distances from housing, maximum saturation levels, and protection for iconic areas.
Coping with intermittency
Wind farms partner nicely with hydro plants on the same grid to create combined power plants, because hydro plants can be uprated with extra turbine units to provide highly dispatchable peak generating capacity above the average flows of their rivers, at lower cost than other peak power options. During periods of high wind and low electricity demand, a hydro plant can reduce its output to accumulate water in its reservoir, whilst wind power handles a higher share of the grid load. Then during periods of low wind, the hydro plant can raise its output temporarily, drawing down its reservoir a bit. Given New Zealand's large proportion of hydroelectric generating capacity, it is better-positioned than most nations to uprate its generating stations and grid to handle intermittent power sources such as wind and solar. The available virtual energy storage represented by hydro plants can be one of the main factors limiting the maximum amount of wind and solar power that a grid can accommodate. Further increases in intermittent power source development may require construction of pumped-storage hydroelectricity and implementation of energy demand management techniques.
Other nations also plan to generate more of their electricity from renewable sources, and are researching solutions for the intermittency problem. The Institute for Solar Energy Supply Technology of the University of Kassel pilot-tested a combined power plant linking solar, wind, biogas and hydrostorage to provide load-following power around the clock, entirely from renewable sources. According to a 2007 Stanford University study published in the Journal of Applied Meteorology and Climatology, interconnecting ten or more wind farms allows 33 to 47% of the total energy produced to be used as reliable, baseload electric power, as long as minimum criteria are met for wind speed and turbine height.
Summary of wind power generation for 2007
Electricity generation via wind turbines is uncontrolled, in that the wind blows or not irrespective of the timing of the demand for electricity. Measurements of the generation over half-hourly intervals are supplied to the Electricity Commission. There are isolated wind turbines at Brooklyn and Gebbie's Pass. At the Te Rere Hau wind farm there are five 500KW wind turbines, however the transmission line to the rest of the electricity grid is limited to one megawatt.
In the charts below, the horizontal layering shows the effect of a single turbine (or a small number of turbines) running at their maximum output:
For Te Rere Hau, however, the graph suggests that this maximum setting is about 200KW, not the nominated 500KW.
The Hau Nui wind farm has an intermediate capacity.
While south of the Manawatu Gorge the Tararua wind farms operate almost in synchrony. Construction of the Tararua III wind farm began in early 2007.
North of the Manawatu Gorge is the TeApiti wind farms, while in Southland the White Hill wind farm began operation.
By contrast, the 464 MW Clyde hydro power station (for example) has its generation timed to suit demand and compensate for low winds, likewise the New Plymouth thermal power station - which was deactivated in October 2007, until the resulting power shortages in 2008 encouraged its partial reactivation.
Combining all the wind generation shows that the total production was uneven over the year due to variations in output.
Availability over a year
An important consideration for the organisation of an electric power generation system is the availability of combined power from its various components. Hydro power stations with a reasonably large lake can be started and stopped at will when wind is low, while thermal power stations are controllable also. Wind turbines of course generate only at the whim of the wind, so the question becomes "How often does the wind blow at useful rates?" From the viewpoint of the electricity system, this becomes "How often does the generator deliver various levels of power?"
This can be assessed via consideration of the "duration" curve, of power vs. the proportion of time at (or below) that power, derived from the observed generation data for some interval (such as a year). Specifically, given measurements at regular intervals (half-hourly is usual in NZ), as were used to produce the plots of generation, sort a year's 17520 values into the order lowest power to highest. A plot of the power as the y-variable and the index of the value's position as the x-variable produces curves such as follow graphs illustrate. For wind power, there is no controllability, except in design choices as to wind speeds for start and stop, so the power output is closely connected to the wind speed.
Examples of returns
For Te Rere Hau for example, the top tenth of the time for generation involves a power drop of two tenths - that is, its maximum generation is 1,000KW, but at the 0.9 mark it is 800KW. A twenty percent drop in output over the top ten percent of outputs. Half the time, the generation is less than 25% of full capacity. For about forty percent of the time the generation is less than ten percent of nominal capacity,and it is zero for about a quarter of the time - the graph shows that the power level does not exceed zero for the first twenty-five percent of the operating time. The timing of the pattern of demand for electricity has low correlation with the wind; this means that wind power is no more available at a time of high demand than it would be at any other time.
A wind farm with many turbines and unconstrained by transmission line capacities does better: here is the output curve for the Hau Nui wind farm
And the Tararua wind farms, distorted by the increase of capacity for Tararua III during 2007.
And Te Apiti (north of the Tararua wind farm) along with White Hill in Southland which commenced operation in 2007.
And for all wind combined, distorted by the changes in active capacity during 2007:
The combined curve is not the summation of the individual duration curves; rather, for each time the values for the wind-powered generation at that time were added, and the sort performed on the sum. Despite the geographical spread, it is clear that at any given time, there is a high chance that the contribution from wind generation will not be a large proportion of the installed capacity. For instance, half the time, it will be no more than a third, and only a quarter of the time will it be above two thirds.
Correlation between different locations
Winds are rarely the same in distant locations over a fairly large area like New Zealand. Scatter plots where a point is placed for each measurement of the year according to station A's generation at that time for the x co-ordinate and station B's generation for the y co-ordinate show the correlation between different wind locations. A fair comparison includes those stations that have not changed in capacity during the year, so this means that White Hill and Tararua III that were under construction in 2007 must be excluded. A later time span could be used when they are no longer under construction. The electricity commission has chosen to no longer release data for wind generation (and many other smaller generation stations).
This plot show that the correlation between Te Apiti and the Tararua I and II wind farms is very high. When one is generating at high levels, the other is also likely to be at high capacity. Conversely, if the output of one is low, the other is likely to be low as well. The two operate almost as one. Further, when the wind is strong north of the gorge it is also strong south of the gorge, and vice versa.
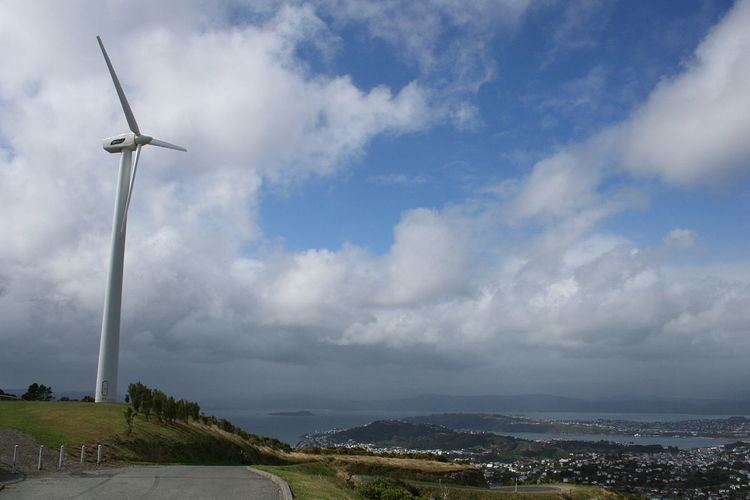
The lone wind turbine at Brooklyn above Wellington is rather further away, and unlike Hau Nui, the Rimutaka mountain range intervenes between it and Te Apiti. Image 2 shows a much smaller correlation. Primarily because when wind is low at one location it is less likely to be low at the other as well. The horizontal layering is a consequence of the data supplied being given only to a 2KW step and the full scale value is just 230KW.
Much further away is the lone wind turbine at Gebbie's Pass by Christchurch, which shows no correlation (image 3). (However, times when there was no generation at both locations would not be well-depicted in this display.)
By contrast, the Clyde hydro power station has controllable generation. It has four turbines and the steps in the duration curve show that one, two, three or four turbines (but not which individual turbines) were operating at their nominal output for various portions of the year. Thus, the Clyde power station was not generating at all for about a twentieth of the year (zero power up to about 0.05 of a year) and ran one turbine only for about a tenth of a year, the flat between 0.1 and 0.2. A hydro turbine is at its most efficient only near its design capacity and the flow of water is controlled accordingly. However, the power output can be varied a little (and the water pressure varies with lake level), nor need the operational level be changed only on half-hour boundaries, so the "flats" of the staircase are not completely flat nor the risers vertical. For new Plymouth, for two thirds of the year's half-hours it was not running at all.
Summary
Wind turbines have no inherant storage of wind for other times of greater need. Just as a wind farm does not always generate at full power so also a hydro power station does not operate at a hundred percent all the time, but this is not the same thing. Averaged over a year Clyde runs at about 60% of its capacity, but this is because a hydro power station typically has more generation capacity installed than could be used by the annual average flow of its river. Given that a hydro power station is being built, an extra generator is not much further expense. The difference is that the excess generation can be started or stopped as the demand for electricity varies (and supply from other generators like wind and gas turn up and down), with the water reservoir either falling or rising correspondingly, but averaged over a long period the flow through the generators matches the river's actual flow since otherwise the lake will overflow or be drained. Thus a hydro power station has good availability (for any given half-hour) while a wind power station does not, even if both offer about the same ratio of average power to maximum power over a year. Together, the hydro dam can thus serve as 'wind storage'.
List of operating wind farms
Only wind turbines and farms over 0.5 MW generating capacity are listed.
Meridian Energy also operates a 1 MW wind farm on Ross Island, Antarctica. It is not included in the above list as it doesn't contribute electricity to the New Zealand national electricity network.
Individual wind turbines
Individual demonstration and prototype wind turbines have been installed at Southbridge in Canterbury, Gebbies Pass near Christchurch and at Brooklyn in Wellington.
Many small windmills serve as windpumps on New Zealand farms.