
 | ||
The characteristics of United States rainfall climatology differ significantly across the United States and those under United States sovereignty. Late summer and fall extratropical cyclones bring a majority of the precipitation which falls across western, southern, and southeast Alaska annually. During the winter, and spring, Pacific storm systems bring Hawaii and the western United States most of their precipitation. Nor'easters moving down the East coast bring cold season precipitation to the Carolinas, Mid-Atlantic and New England states. Lake-effect snows add to precipitation potential downwind of the Great Lakes, as well as Great Salt Lake and the Finger Lakes during the cold season. The snow to liquid ratio across the contiguous United States averages 13:1, meaning 13 inches (330 mm) of snow melts down to 1 inch (25 mm) of water.
Contents
- General
- Alaska
- West
- Lake effect snow off Great Salt Lake
- North American Monsoon
- Great Plains
- Cold season
- Warm season
- Northeast
- Hawaii
- Northern Marianas
- Guam
- American Samoa
- Puerto Rico
- United States Virgin Islands
- Changes due to global warming
- References
During the summer, the North American monsoon combined with Gulf of California and Gulf of Mexico moisture moving around the subtropical ridge in the Atlantic Ocean bring the promise of afternoon and evening air-mass thunderstorms to the southern tier of the country as well as the Great Plains. Equatorward of the subtropical ridge, tropical cyclones enhance precipitation across southern and eastern sections of the country, as well as Puerto Rico, the United States Virgin Islands, the Northern Mariana Islands, Guam, and American Samoa. Over the top of the ridge, the jet stream brings a summer precipitation maximum to the Great Lakes. Large thunderstorm areas known as mesoscale convective complexes move through the Plains, Midwest, and Great Lakes during the warm season, contributing up to 10% of the annual precipitation to the region.
The El Niño–Southern Oscillation affects the precipitation distribution, by altering rainfall patterns across the West, Midwest, the Southeast, and throughout the tropics. There is also evidence that global warming is leading to increased precipitation to the eastern portions of North America, while droughts are becoming more frequent in the western portions.
General
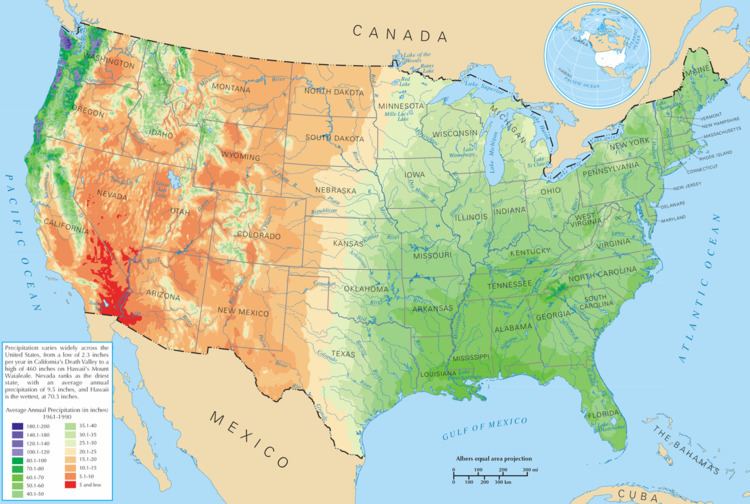
The eastern part of the contiguous United States east of the 98th meridian, the mountains of the Pacific Northwest, the Willamette Valley, and the Sierra Nevada range are the wetter portions of the nation, with average rainfall exceeding 30 inches (760 mm) per year. The drier areas are the Desert Southwest, Great Basin, valleys of northeast Arizona, eastern Utah, and central Wyoming. Increased warming within urban heat islands leads to an increase in rainfall downwind of cities.
Alaska
Juneau averages over 50 inches (1,270 mm) of precipitation a year, while other areas in southeast Alaska receive over 275 inches (6,980 mm). South central Alaska does not get nearly as much rain as the southeast of Alaska, though it does get more snow. On average, Anchorage receives 16 inches (406 mm) of precipitation a year, with around 75 inches (1,905 mm) of snow. The northern coast of the Gulf of Alaska receives up to 150 inches (3,800 mm) of precipitation annually. Across western sections of the state, the northern side of the Seward Peninsula is a desert with less than 10 inches (250 mm) of precipitation annually, while some locations between Dillingham and Bethel average around 100 inches (2,540 mm) of precipitation. Inland, often less than 10 inches (250 mm) falls a year, but what precipitation falls during the winter tends to stay throughout the season. La Niña events lead to drier than normal conditions, while El Niño events do not have a correlation towards dry or wet conditions. Precipitation increases by 10 to 40 percent when the Pacific decadal oscillation is positive.
West
From September through May, extratropical cyclones from the Pacific Ocean move inland into the region due to a southward migration of the jet stream during the cold season. This shift in the jet stream brings much of the annual precipitation to the region, and also brings the potential for heavy rain events. The West Coast occasionally experiences ocean-effect showers, usually in the form of rain at lower elevations south of the mouth of the Columbia River. These occur whenever an Arctic air mass from western Canada is drawn westward out over the Pacific Ocean, typically by way of the Fraser Valley, returning shoreward around a center of low pressure. Strong onshore flow is brought into the mountain ranges of the west, focusing significant precipitation into the Rocky Mountains, with rain shadows occurring in the Harney Basin, Great Basin, the central valley of California, and the lower Colorado River valley. In general, rainfall amounts are lower on the southern portions of the West coast. The biggest recipients of the precipitation are the coastal ranges such as the Olympic Mountains, the Cascades, and the Sierra Nevada range. Lesser amounts fall upon the Continental Divide. Cold-season precipitation into this region is the main supply of water to area rivers, such as the Colorado River and Rio Grande, and also acts as the main source of water to people living in this portion of the United States. During El Niño events, increased precipitation is expected in California due to a more southerly, zonal, storm track. California also enters a wet pattern when thunderstorm activity within the tropics associated with the Madden–Julian oscillation nears 150E longitude. During La Niña, increased precipitation is diverted into the Pacific Northwest due to a more northerly storm track.
Lake-effect snow off Great Salt Lake
The southern and southeastern sides of the Great Salt Lake receive significant lake-effect snow. Since the Great Salt Lake never freezes, the lake-effect can affect the weather along the Wasatch Front year around. The lake-effect largely contributes to the 55 inches (140 cm) to 80 inches (200 cm) annual snowfall amounts recorded south and east of the lake, with average snowfall amounts exceeding 600 inches (1,500 cm) in the Wasatch Mountains. The snow, which is often very light and dry due to the desert climate, is referred to as "The Greatest Snow on Earth" in the mountains. Lake-effect snow contributes to approximately 6-8 snowfalls per year in Salt Lake City, with approximately 10% of the city's precipitation being contributed by the phenomenon.
North American Monsoon
The North American Monsoon (NAM) occurs from early July into September, originating over Mexico and spreading into the southwest United States by mid-July. This allows the wet season to start in the Southwest during the summer rather than early fall as seen across the remainder of the West. Within the United States, it affects Arizona, New Mexico, Nevada, Utah, Colorado, West Texas, and California. The North American monsoon is known to many as the Summer, Southwest, Mexican or Arizona monsoon. It is also sometimes called the Desert Monsoon as a large part of the affected area is desert.
When precipitable water values near 1.32 inches (34 mm), brief but often torrential thunderstorms can occur, especially over mountainous terrain. This activity is occasionally enhanced by the passage of retrograding (westward-moving) upper cyclones moving under the subtropical ridge and the entrainment of the remnants of tropical storms. Tropical cyclones from the eastern Pacific contribute to the moisture within the monsoon system, and bring up to 20 percent of the average annual rainfall to southern California. Flash flooding is a serious danger during the monsoon season. Dry washes can become raging rivers in an instant, even when no storms are visible as a storm can cause a flash flood tens of miles away. Lightning strikes are also a significant danger. Because it is dangerous to be caught in the open when these storms suddenly appear, many golf courses in Arizona have thunderstorm warning systems.
As much as 45% of the annual rainfall across New Mexico occurs during the summer monsoon. Many desert plants are adapted to take advantage of this brief wet season. Because of the monsoons, the Sonoran and Mojave are considered relatively "wet" when ranked among other deserts such as the Sahara. Monsoons play a vital role in managing wildfire threat by providing moisture at higher elevations and feeding desert streams. Heavy monsoon rain can lead to excess winter plant growth, in turn a summer wildfire risk. A lack of monsoon rain can hamper summer seeding, reducing excess winter plant growth but worsening drought.
Great Plains
Downslope winds off the Rocky Mountains can aid in forming the dry line. Major drought episodes in the midwestern United States are associated with an amplification of the upper tropospheric subtropical (or monsoon) ridge across the West and Plains, along with a weakening of the western edge of the "Bermuda high". During the summer, a southerly low-level jet draws moisture from the Gulf of Mexico. Additional moisture comes from more local sources, especially transpiring vegetation. Maximum precipitation generally occurs in late spring and early summer, with minimum precipitation in winter. During La Niña events, the storm track shifts far enough northward to bring wetter than normal conditions (in the form of increased snowfall) to the Midwestern states, as well as hot and dry summers.
The convective season for the Plains ranges between May and September. Organized systems of thunderstorms known as mesoscale convective systems develop over the region during this period, with a bulk of the activity occurring between midnight and 6 a.m. local time. The time of maximum precipitation during the day gradually varies from late afternoon near the slopes of the Rockies to early morning near the Ohio River valley, in part reflecting the west-to-east propagation of mesoscale convective systems. Mesoscale convective systems bring 30 to 70 percent of the annual warm season rainfall to the Plains. An especially long-lived and well-organized type of mesoscale convective system called a mesoscale convective complex produces on average 8% to 18% of the annual warm season rainfall across the Plains and Midwest. Squall lines account for 30% of the large thunderstorm complexes which move through the region.
Cold season
The subtropical jet stream brings in upper level moisture from the Pacific Ocean during the cold season. Ahead of storm systems, significant moisture becomes drawn in from the Gulf of Mexico, which increases moisture within the atmospheric column and leads to precipitation ahead of extratropical cyclones. During the El Niño portion of ENSO, increased precipitation falls along the Gulf coast and Southeast due to a stronger than normal, and more southerly, polar jet stream. Rare ocean effect snows are possible along the coast of eastern Florida. In the area around Memphis, Tennessee and across the state of Mississippi, there are two rainfall maxima in the winter and spring. Across Georgia and South Carolina, the first of the annual precipitation maxima occurs in late winter, during February or March. Alabama has an annual rainfall maximum in winter or spring and a dry summer.
Warm season
During the summer, the subtropical ridge in the Atlantic Ocean strengthens, bringing in increasingly humid air from the warm Atlantic, Caribbean, and Gulf of Mexico. Once precipitable water values exceed 1.25 inches (32 mm), afternoon and evening thunderstorms break out at the western periphery of the subtropical ridge across the Southeast on a daily basis. Summer is the time of the second rainfall maximum during the year across Georgia, and the time of the main rainfall maximum in Florida. Evidence shows that increased air pollution is causing rainfall to reach a maximum in intensity during the middle of the week. During the late summer and fall, tropical cyclones move into the region from the Atlantic and Gulf of Mexico, supplying portions of the area with one-quarter of their annual rainfall, on average. Fall is the time of the rainfall minimum across Louisiana. Sometimes, Gulf moisture sneaks up the Front Range of Rockies as far north as the northern High Plains, bringing higher dewpoint air into states such as Wyoming and Montana.
Cold season
Extratropical cyclones can bring moderate to heavy snowfall during the cold season. On the backside of these systems, particularly those moving through the eastern United States, lake effect snowfall is possible. Low level cold in the winter sweeping in from Canada combine with relatively warmer, unfrozen lakes to produce dramatic lake-effect snow on the eastern and southern shores of the Great Lakes. Lake-effect precipitation produces a significant difference between the snowfall around the Great Lakes, sometimes within small distances. Lake effect snowfall accounts for 30 to 60 percent of the annual snowfall near the coasts of the Great Lakes. Lake Erie has the distinction of being the only great lake capable of completely freezing over during the winter due to its relative shallowness. Once frozen, the resulting ice cover alleviates lake-effect snow downwind of the lake. The influence of the Great Lakes allows the region to lie within a Humid Continental Climate regime.
Warm season
Late spring through summer is the wettest time of the year for the region. Weather systems in the westerlies that cause precipitation move along jet stream, which migrates north into the region by summer. This also increases the likelihood for severe weather to develop due to stronger upper-level divergence in its vicinity. Mesoscale convective complexes move into the region from the Plains from May through August, with June the peak month for Michigan. These systems contribute about 2% of the annual precipitation for the region. Also, remnants of tropical cyclones occasionally move northward into the region, though their overall contribution to precipitation across the region is minimal. From the spring through the summer, areas near the shores of the relatively cooler Great Lakes develop sea breezes, which lowers rainfall amounts near the immediate coastline.
Northeast
Average precipitation across the region show maxima along the coastal plain and along the mountains of the Appalachians. Between 28 inches (710 mm) and 62 inches (1,600 mm) of precipitation falls annually across the area. Seasonally, there are slight changes to precipitation distribution through the year. For example, Burlington, Vermont has a summer maximum and a winter minimum. In contrast, Portland, Maine has a fall and winter maximum, with a summer minimum in precipitation. Temporally, a maximum in precipitation is seen around three peak times: 3 a.m., 10 a.m., and 6 p.m. During the summer, the 6 p.m. peak is most pronounced.
Cold season
Coastal extratropical cyclones, known as nor'easters, bring a bulk of the wintry precipitation to the region during the cold season as they track parallel to the coastline, forming along the natural temperature gradient of the Gulf stream before moving up the coastline. The Appalachian Mountains largely shield New York City and Philadelphia from picking up any lake-effect snow, though ocean-effect snows are possible near Cape Cod. The Finger Lakes of New York are long enough for lake-effect precipitation. Lake-effect snow from the Finger Lakes occurs in upstate New York until those lakes freeze over. Bay-effect snows fall downwind of Delaware Bay, Chesapeake Bay, and Massachusetts Bay when the basic criteria are met. Ocean effect snows are possible downwind of the Gulf Stream across the Southeast.
Warm season
During the summer and early fall, mesoscale convective systems can move into the area from Canada and the Great Lakes. Tropical cyclones and their remains occasionally move into the region from the south and southwest. Recently, the region has experienced a couple heavy rainfall events that exceeded the 50-year return period, during October 1996 and October 1998, which suggest an increase in heavy rainfall along the coast.
Hawaii
Snow, although not usually associated with tropics, falls at higher elevations on the Big Island, on Mauna Loa as well as Mauna Kea, which reaches an altitude of 13,796 feet (4,205 m) in some winter months. Snow only rarely falls on Maui's Haleakala. Mount Waiʻaleʻale (Waiʻaleʻale), on the island of Kauai, is notable for its extreme rainfall, as it has the second highest average annual rainfall on Earth, with 460 inches (12,000 mm). Storm systems affect the state with heavy rains between October and March. Showers are common across the island chain, but thunderstorms are relatively rare. Local climates vary considerably on each island due to their topography, divisible into windward (Koʻolau) and leeward (Kona) regions based upon location relative to the higher mountains. The Kona coast is the only area in Hawaii with a summer precipitation maximum. Windward sides face the east to northeast trade winds and receive much more rainfall; leeward sides are drier and sunnier, with less rain and less cloud cover. In the late winter and spring during El Niño events, drier than average conditions can be expected in Hawaii.
Northern Marianas
The islands have a tropical marine climate moderated by seasonal northeast trade winds. There is a dry season which stretches from December to June, and a rainy season from July to November. Saipan's average annual precipitation is 82.36 inches (2,092 mm), with 67 percent falling during the rainy season. Typhoons frequent the island chain, which can lead to excessive rainfall.
Guam
Guam's climate is moderated by east to northeast trade winds through the year. The average annual rainfall for the island is 86 inches (2,200 mm). There is a distinct dry season from January to June, and a rainy season from July to December. Typhoons frequent the island, which can lead to excessive rainfall. During El Niño years, dry season precipitation averages below normal. However, the threat of a tropical cyclone is over triple what is normal during El Niño years, so extreme shorter duration rainfall events are possible.
American Samoa
American Samoa's climate regime is dominated by southeast trade winds. The island dependency is wet, with annual rainfall averaging near 120 inches (3,000 mm) at the airport, with amounts closer to 200 inches (5,100 mm) in other areas. There is a distinct rainy season when tropical cyclones occasionally visit between November and April. The dry season lasts from May to October. During El Niño events, precipitation averages about 10 percent above normal, while La Niña events lead to precipitation amounts which average close to 10 percent below normal.
Puerto Rico
There is a pronounced rainy season from April to November across the commonwealth, encompassing the annual hurricane season. Due to the commonwealth's topography, rainfall varies greatly across the island. Pico del Este averages 171.09 inches (4,346 mm) of rainfall yearly while Magueyes Island averages only 29.32 inches (745 mm) a year. Despite known changes in tropical cyclone activity due to changes in the El Niño/Southern Oscillation (ENSO), there is no known relationship between rainfall in Puerto Rico and the ENSO cycle. However, when values of the North Atlantic oscillation are high during the winter, precipitation is lower than average for Puerto Rico. There have not been any documented cases of snow falling within Puerto Rico, though occasionally it is brought in from elsewhere as a publicity stunt.
United States Virgin Islands
The climate of the United States Virgin Islands has sustained easterly trade winds through the year. There is a rainy season which lasts from September to November, when hurricanes are more prone to visit the island chain. The average rainfall through the island chain ranges from 51.55 inches (1,309 mm) at Annually to 37.79 inches (960 mm) at East Hill.
Changes due to global warming
Increasing temperatures tend to increase evaporation which leads to more precipitation. As average global temperatures have risen, average global precipitation has also increased. Precipitation has generally increased over land north of 30°N from 1900 to 2005, but declined over the tropics since the 1970s. Eastern portions of North America have become wetter. There has been an increase in the number of heavy precipitation events over many areas during the past century, as well as an increase since the 1970s in the prevalence of droughts—especially in the tropics and subtropics. Over the contiguous United States, total annual precipitation increased at an average rate of 6.1 percent per century since 1900, with the greatest increases within the East North Central climate region (11.6 percent per century) and the South (11.1 percent). Hawaii was the only region to show a decrease (−9.25 percent). From this excess precipitation, crop losses are expected to increase by US$3 billion (2002 dollars) annually over the next 30 years.