
 | ||
Two-dimensional infrared spectroscopy (2DIR) is a nonlinear infrared spectroscopy technique that has the ability to correlate vibrational modes in condensed-phase systems. This technique provides information beyond linear infrared spectra, by spreading the vibrational information along multiple axes, yielding a frequency correlation spectrum. A frequency correlation spectrum can offer structural information such as vibrational mode coupling, anharmonicities, along with chemical dynamics such as energy transfer rates and molecular dynamics with femtosecond time resolution. 2DIR experiments have only become possible with the development of ultrafast lasers and the ability to generate femtosecond infrared pulses.
Contents
Systems studied
Among the many systems studied with infrared spectroscopy are water, metal carbonyls, short polypeptides, proteins, perovskite solar cells, and DNA oligomers.
Experimental approaches
There are two main approaches to two-dimensional spectroscopy, the Fourier-transform method, in which the data is collected in the time-domain and then Fourier-transformed to obtain a frequency-frequency 2D correlation spectrum, and the frequency domain approach in which all the data is collected directly in the frequency domain.
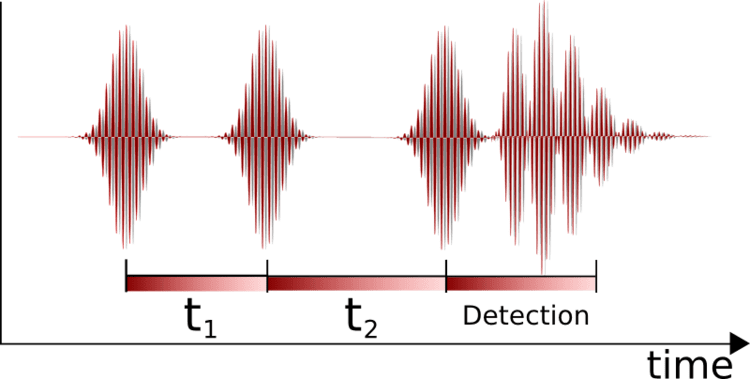
Time domain
The time-domain approach consists of applying two pump pulses. The first pulse creates a coherence between the vibrational modes of the molecule and the second pulse creates a population, effectively storing information in the molecules. After a determined waiting time, ranging from a zero to a few hundred picoseconds, an interaction with a third pulse again creates a coherence, which, due to an oscillating dipole, radiates an infrared signal. The radiated signal is heterodyned with a reference pulse in order to retrieve frequency and phase information; the signal is usually collected in the frequency domain using a spectrometer yielding detection frequency
Frequency domain
Similarly, in the frequency-domain approach, a narrowband pump pulse is applied and, after a certain waiting time, then a broadband pulse probes the system. A 2DIR correlation spectrum is obtained by plotting the probe frequency spectrum at each pump frequency.
Spectral interpretation
After the waiting time in the experiment, it is possible to reach doubly excited states. This results in the appearance of an overtone peak. The anharmonicity of a vibration can be read from the spectra as the distance between the diagonal peak and the overtone peak. One obvious advantage of 2DIR spectra over normal linear absorption spectra is that they reveal the coupling between different states. This for example allows for the determination of the angle between the involved transition dipoles.
The true power of 2DIR spectroscopy is that it allows following dynamical processes such as chemical exchange, vibrational population transfer, and molecular reorientation on the sub-picosecond time scale. It has for example been used successfully to study hydrogen bond forming and breaking and to determine the transition state geometry of a structural rearrangement in an iron carbonyl compound. Spectral interpretation can be successfully assisted with developed theoretical methods.
Currently two freely available packages exists for modelling 2D IR spectra. These are the SPECTRON developed by the Mukamel group (University of California, Irvine) and the NISE program developed by the Jansen group (University of Groningen).
Solvent effect
The consideration of the solvent effect has been shown to be crucial in order to effectively describe the vibrational coupling in solution, since the solvent modify both vibrational frequencies, transition probabilities and couplings. Computer simulations can reveal the spectral signatures arising from solvent degrees of freedom and their change upon water reorganization.