
 | ||
1929 the great crash a video about the stock market crash in 1929
A stock market crash is a sudden dramatic decline of stock prices across a significant cross-section of a stock market, resulting in a significant loss of paper wealth. Crashes are driven by panic as much as by underlying economic factors. They often follow speculative stock market bubbles.
Contents
- 1929 the great crash a video about the stock market crash in 1929
- Mathematical theory
- Wall Street Crash of 1929
- Crash of 20082009
- Mitigation strategies
- United States
- France
- References
Stock market crashes are social phenomena where external economic events combine with crowd behavior and psychology in a positive feedback loop where selling by some market participants drives more market participants to sell. Generally speaking, crashes usually occur under the following conditions: a prolonged period of rising stock prices and excessive economic optimism, a market where P/E ratios exceed long-term averages, and extensive use of margin debt and leverage by market participants.
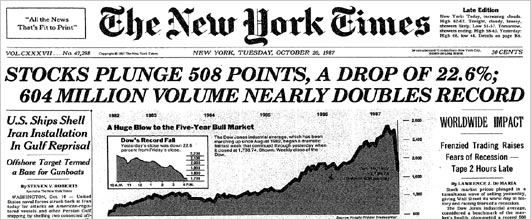
There is no numerically specific definition of a stock market crash but the term commonly applies to steep double-digit percentage losses in a stock market index over a period of several days. Crashes are often distinguished from bear markets by panic selling and abrupt, dramatic price declines. Bear markets are periods of declining stock market prices that are measured in months or years. Crashes are often associated with bear markets, however, they do not necessarily go hand in hand. The crash of 1987, for example, did not lead to a bear market. Likewise, the Japanese bear market of the 1990s occurred over several years without any notable crashes.
Mathematical theory
The mathematical description of stock market movements has been a subject of intense interest. The conventional assumption has been that stock markets behave according to a random log-normal distribution. Among others, mathematician Benoît Mandelbrot suggested as early as 1963 that the statistics prove this assumption incorrect. Mandelbrot observed that large movements in prices (i.e. crashes) are much more common than would be predicted from a log-normal distribution. Mandelbrot and others suggested that the nature of market moves is generally much better explained using non-linear analysis and concepts of chaos theory. This has been expressed in non-mathematical terms by George Soros in his discussions of what he calls reflexivity of markets and their non-linear movement. George Soros said in late October 1987, 'Mr. Robert Prechter's reversal proved to be the crack that started the avalanche'.
Research at the Massachusetts Institute of Technology suggests that there is evidence the frequency of stock market crashes follows an inverse cubic power law. This and other studies such as Prof. Didier Sornette's work suggest that stock market crashes are a sign of self-organized criticality in financial markets. In 1963, Mandelbrot proposed that instead of following a strict random walk, stock price variations executed a Lévy flight. A Lévy flight is a random walk that is occasionally disrupted by large movements. In 1995, Rosario Mantegna and Gene Stanley analyzed a million records of the S&P 500 market index, calculating the returns over a five-year period. Researchers continue to study this theory, particularly using computer simulation of crowd behaviour, and the applicability of models to reproduce crash-like phenomena.
Research at the New England Complex Systems Institute has found warning signs of crashes using new statistical analysis tools of complexity theory. This work suggests that the panics that lead to crashes come from increased mimicry in the market. A dramatic increase in market mimicry occurred during the whole year before each market crash of the past 25 years, including the recent financial crisis. When investors closely follow each other's cues, it is easier for panic to take hold and affect the market. This work is a mathematical demonstration of a significant advance warning sign of impending market crashes.
The Hindenburg Omen, developed by physics professor Jim Miekka, is a controversial indicator that is believed by many to predict stock market crashes.
A recent phenomenon, known as the RR Reversal, has also been well documented in recent years – where a rapidly increasing stock experiences an inexplicable and sudden pullback to the magnitude of 10 – 40% within a month.
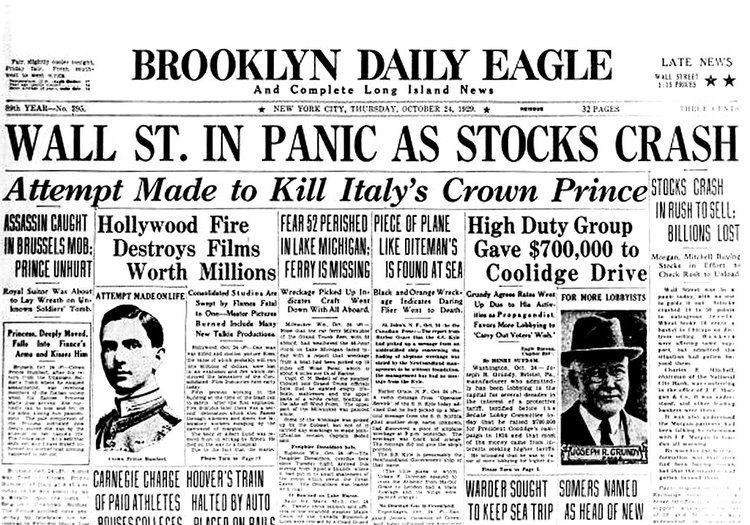
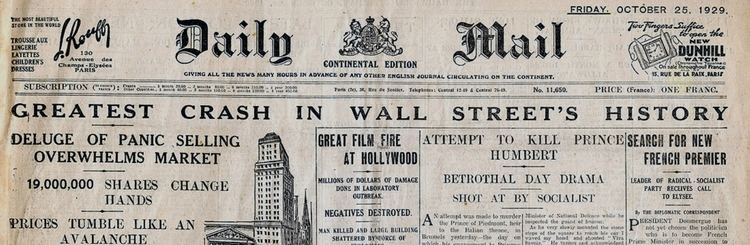
Wall Street Crash of 1929
The economy had been growing fluently for most of the Roaring Twenties. It was a technological golden age, as innovations such as the radio, automobile, aviation, telephone, and the power grid were deployed and adopted. Companies that had pioneered these advances, like Radio Corporation of America (RCA) and General Motors, saw their stocks soar. Financial corporations also did well, as Wall Street bankers floated mutual fund companies (then known as investment trusts) like the Goldman Sachs Trading Corporation. Investors were infatuated with the returns available in the stock market, especially by the use of leverage through margin debt.
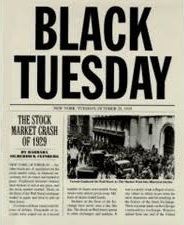
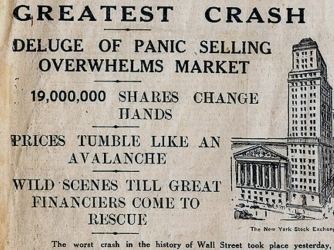
On August 24, 1921, the Dow Jones Industrial Average stood at a value of 63.9. By September 3, 1929, it had risen more than sixfold, touching 381.2. It would not regain this level for another 25 years. By the summer of 1929, it was clear that the economy was contracting, and the stock market went through a series of unsettling price declines. These declines fed investor anxiety, and events came to a head on October 24, 28, and 29 (known respectively as Black Thursday, Black Monday, and Black Tuesday).
On Black Monday, the Dow Jones Industrial Average fell 121 points to 260, a drop of 31.8%. The deluge of selling overwhelmed the ticker tape system that normally gave investors the current prices of their shares. Telephone lines and telegraphs were clogged and were unable to cope. This information vacuum only led to more fear and panic. The technology of the New Era, previously much celebrated by investors, now served to deepen their suffering.
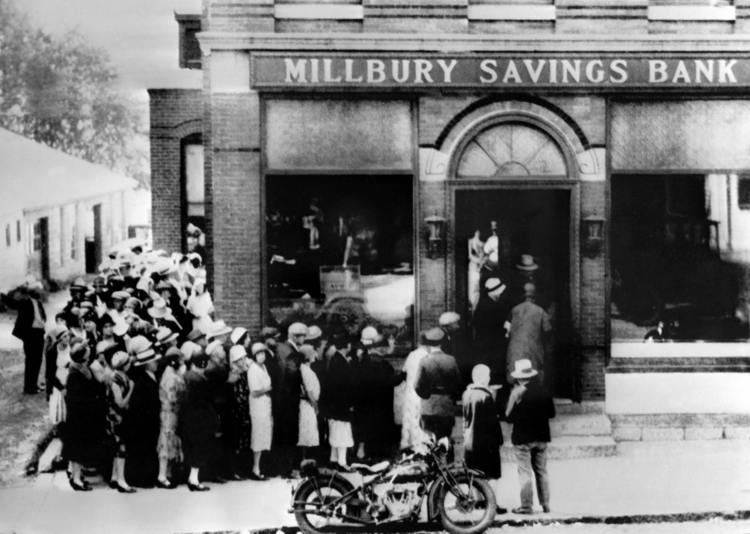
The following day, Black Tuesday, was a day of chaos. Forced to liquidate their stocks because of margin calls, overextended investors flooded the exchange with sell orders. The Dow fell 30 points to close at 230 on that day. The glamour stocks of the age saw their values plummet. Across the two days, the Dow Jones Industrial Average fell 38%.
By the end of the weekend of November 11, the index stood at 228, a cumulative drop of 40% from the September high. The markets rallied in succeeding months, but it was a temporary recovery that led unsuspecting investors into further losses. The Dow Jones Industrial Average lost 89% of its value before finally bottoming out in July 1932. The crash was followed by the Great Depression, the worst economic crisis of modern times, which plagued the stock market and Wall Street throughout the 1930s.
Crash of 2008–2009
On September 16, 2008, failures of massive financial institutions in the United States, due primarily to exposure to packaged subprime loans and credit default swaps issued to insure these loans and their issuers, rapidly devolved into a global crisis. This resulted in a number of bank failures in Europe and sharp reductions in the value of stocks and commodities worldwide. The failure of banks in Iceland resulted in a devaluation of the Icelandic króna and threatened the government with bankruptcy. Iceland obtained an emergency loan from the International Monetary Fund in November. In the United States, 15 banks failed in 2008, while several others were rescued through government intervention or acquisitions by other banks. On October 11, 2008, the head of the International Monetary Fund (IMF) warned that the world financial system was teetering on the "brink of systemic meltdown".
The economic crisis caused countries to close their markets temporarily.
On October 8, the Indonesian stock market halted trading, after a 10% drop in one day.
The Times of London reported that the meltdown was being called the Crash of 2008, and older traders were comparing it with Black Monday in 1987. The fall that week of 21% compared to a 28.3% fall 21 years earlier, but some traders were saying it was worse. "At least then it was a short, sharp, shock on one day. This has been relentless all week.” Business Week also referred to the crisis as a "stock market crash" or the "Panic of 2008."
From October 6-10 the Dow Jones Industrial Average (DJIA) closed lower in all five sessions. Volume levels were record-breaking. The DJIA fell over 1,874 points, or 18%, in its worst weekly decline ever on both a points and percentage basis. The S&P 500 fell more than 20%. The week also set 3 top ten NYSE Group Volume Records with October 8 at #5, October 9 at #10, and October 10 at #1.
The daily stock market drops in 2008 were overall nowhere near as bad as in the last stock market crash in 1987. It was suggested that the media were manipulating and over-inflating stock market drops and calling them "crashes" in order to create the perception of a great depression.
Having been suspended for three successive trading days (October 9, 10, and 13), the Icelandic stock market reopened on 14 October, with the main index, the OMX Iceland 15, closing at 678.4, which was about 77% lower than the 3,004.6 at the close on October 8. This reflected that the value of the three big banks, which had formed 73.2% of the value of the OMX Iceland 15, had been set to zero.
On October 24, many of the world's stock exchanges experienced the worst declines in their history, with drops of around 10% in most indices. In the US, the DJIA fell 3.6%, i.e. not as much as other markets. Instead, both the US dollar and Japanese yen soared against other major currencies, particularly the British pound and Canadian dollar, as world investors sought safe havens. Later that day, the deputy governor of the Bank of England, Charles Bean, suggested that "This is a once in a lifetime crisis, and possibly the largest financial crisis of its kind in human history."
By March 6, 2009 the DJIA had dropped 54% to 6,469 (before beginning to recover) from its peak of 14,164 on October 9, 2007, over a span of 17 months.
Mitigation strategies
One mitigation strategy has been the introduction of trading curbs, also known as "circuit breakers", which are a trading halt in the cash market and the corresponding trading halt in the derivative markets triggered by the halt in the cash market, all of which are affected based on substantial movements in a broad market indicator.
United States
There are three thresholds, which represent different levels of decline in the DJIA in terms of points. These thresholds are set at the beginning of each quarter to establish a specific point value. For example, in the second quarter of 2011, Threshold 1 was a drop of 1200 points, Threshold 2 was 2400 points, and Threshold 3 was 3600 points.
France
In France, the main French stock index is called the CAC 40. Daily price limits are implemented in cash and derivative markets. Securities traded on the markets are divided into three categories according to the number and volume of daily transactions. Price limits for each security vary by category. For instance, for the more liquid category, when the price movement of a security from the previous day's closing price exceeds 10%, the quotation is suspended for 15 minutes, and transactions are then resumed. If the price then goes up or down by more than 5%, transactions are again suspended for 15 minutes. The 5% threshold may apply once more before transactions are halted for the rest of the day. When such a suspension occurs, transactions on options based on the underlying security are also suspended. Further, when more than 35% of the capitalization of the CAC40 Index cannot be quoted, the calculation of the CAC40 Index is suspended and the index is replaced by a trend indicator. When less than 25% of the capitalization of the CAC40 Index can be quoted, quotations on the derivative markets are suspended for half an hour or one hour, and additional margin deposits are requested.