
 | ||
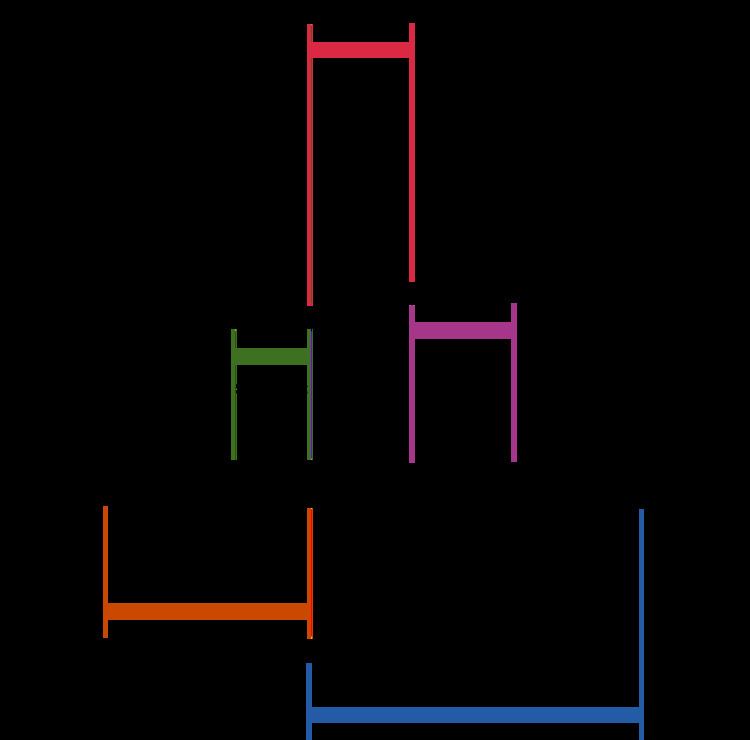
In electrocardiography, the ST segment connects the QRS complex and the T wave and has a duration of 0.080 to 0.120 sec (80 to 120 ms).
Contents
It starts at the J point (junction between the QRS complex and ST segment) and ends at the beginning of the T wave. However, since it is usually difficult to determine exactly where the ST segment ends and the T wave begins, the relationship between the ST segment and T wave should be examined together. The typical ST segment duration is usually around 0.08 sec (80 ms). It should be essentially level with the PR and TP segment.
The ST segment represents the period when the ventricles are depolarized. It is isoelectric.
Interpretation
In fetal monitoring
In fetal electrocardiography, ST waveform analysis (sometimes abbreviated STAN) is used to get an indication of increasing levels of fetal base deficit.