
 | ||
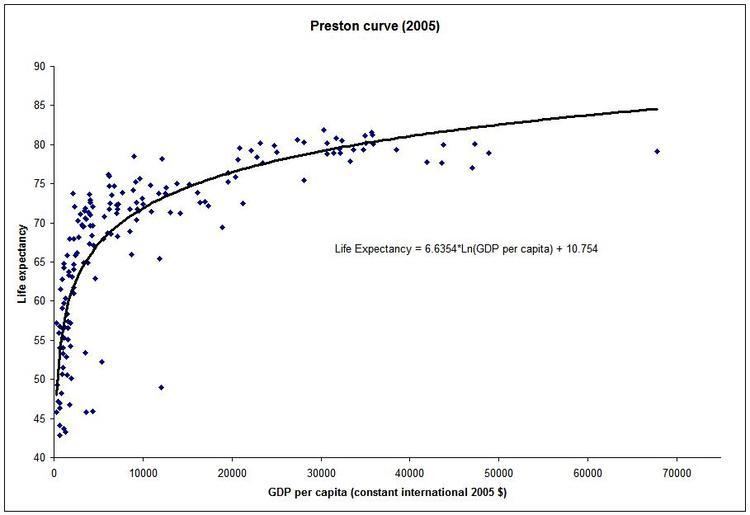
The Preston curve is an empirical cross-sectional relationship between life expectancy and real per capita income. It is named after Samuel H. Preston who first described it in 1975. Preston studied the relationship for the 1900s, 1930s and the 1960s and found it held for each of the three decades. More recent work has updated this research.
Contents
The relationship between life expectancy and income
The Preston curve indicates that individuals born in richer countries, on average, can expect to live longer than those born in poor countries. However, the link between income and life expectancy flattens out. This means that at low levels of per capita income, further increases in income are associated with large gains in life expectancy, but at high levels of income, increased income has little associated change in life expectancy. In other words, if the relationship is interpreted as being causal, then there are diminishing returns to income in terms of life expectancy.
A further significant finding of Preston's study was that the curve has shifted upwards during the 20th century. This means that life expectancy has increased in most countries, independently of changes in income. Preston credited education, better technology, vaccinations, improved provision of public health services, oral rehydration therapy and better nutrition with these exogenous improvements in health. According to Preston, the independent increases in life expectancy have been greatest in the poor countries, although he also believed that a good portion of the potential gains from better medical technology have not been realized. Several poor countries in Sub-Saharan Africa have actually seen declines in life expectancy in the 1990s and 2000s as a result of the HIV/AIDS epidemic, even if their per capita incomes have increased during this time.
Overall Preston found that improvements in health technology (the upwards shifts in the curve) accounted for 75% to 90% of the increase in life expectancy, while income growth (movement along the curve) was responsible for the rest.
Analysis of more recent data, for example by Michael Spence and Maureen Lewis, suggests that the "fit" of the relationship has become stronger in the decades since Preston's study. Though the source of income growth, rather than growth itself has been shown to be significant, with Ryan Edwards finding divergences from the Preston Curve partially explained by the size of the mining sector (a mining dominated economy).
While the relationship between income and life expectancy is log linear on average, any one individual country can lie above or below curve. Those below the curve, such as South Africa or Zimbabwe, have life expectancy levels that are lower than would be predicted based on per capita income alone. Countries above the curve, such as Tajikistan, have life expectancies that are exceptionally high given their level of economic development. In 2000, the USA lay just below the curve, indicating that it had a slightly lower life expectancy than other rich countries.
If the relationship is estimated with nonparametric regression then it produces a version of the curve which has a "hinge" – i.e. a kink in the relationship where the slope of the regression equation falls off significantly. This point occurs around the per capita income level of $2,045 (data for the year 2000) which is about the per capita income level of India. This level of income is generally associated with a crossing of a "epidemiological transition", where countries change from having most of their mortality occur due to infant mortality to that due to old age mortality, and from prevalence of infectious diseases to that of chronic diseases.
Implications
The fact that the relationship between income and health is concave indicates that a transfer of income from the rich to the poor would increase the average health of a society. However, this policy prescription will have this effect only if the relationship between income and health is causal – i.e. if higher income causes longer life expectancy (see below). If the relationship is driven by other factors, if it is spurious, or if it is in fact health that leads to higher income, then this policy outcome will no longer be true.
The existence of the Preston curve has been used by Lant Pritchett and Larry Summers to argue that poor countries should focus on economic growth, and that health improvements will come about spontaneously as a result of increases in income. According to these authors, in 1990 better economic performance could have prevented more than half a million child deaths worldwide. However, the upward shifts of the Preston curve still imply that the main portion of gains in life expectancy has come about as a result of improved health technology rather than just increases in per capita income. Preston did, however, acknowledge that in the poorest countries economic growth may be necessary for improvements in health, as even the most inexpensive technologies have a cost of adoption that poor countries may not be able to afford.
Preston's work has also contributed to the broadening of the definition of economic development. Gary Becker et al. have included longevity in a more general welfare measure and have illustrated that increases in life expectancy have made up a large portion of increases in overall global welfare since the 1960s. In the same work, Becker et al. also found that while cross-country incomes have diverged, the distribution of health has converged.
Lack of longitudinal evidence
The Preston curve is a relationship found in cross-country data - that is, it holds for a sample of countries taken at a particular point in time. Some research however suggests that a similar relationship does not hold in time series and longitudinal data within individual countries. In particular, per capita incomes between countries have generally diverged over time, while life expectancies, and other health indicators such as the infant mortality rates, have converged (this trend was interrupted in the 1990s with the outbreak of the AIDS epidemic in Sub-Saharan Africa). This suggests that over time changes in income may have no impact on health or even be negatively related.
Causality
A further limitation of the correlation is that it does not necessarily imply that the causality runs from income to health. It could actually be that better health, as proxied by life expectancy, contributes to higher incomes, rather than vice versa. Better health can increase incomes because healthier individuals tend to be more productive than sick ones; on average they work harder, longer and are more capable of focusing efficiently on production tasks. Furthermore, better health may affect not just the level of income but also its growth rate through its effect on education. Healthier children spend more time at school and learn faster, thus acquiring more human capital which translates into higher growth rates of incomes later in life. Diseases such as malaria can short circuit these processes. Likewise there is evidence that more healthy individuals save more and thus contribute to the faster accumulation of physical capital of an economy. Jeffrey Sachs in particular has emphasized the role that the disease burden has played in the impoverishment of countries located in the tropical zones.
The problem of reverse causality between health and income means that any estimates of the impact of income on life expectancy could mistakenly reflect the influence of life expectancy (more generically, health) on income instead. As such, studies which do not account for this potential two-way causation may overestimate the importance of income for life expectancy. In economic research, this kind of problem has traditionally been dealt with through the use of instrumental variables which allow the researcher to separate out one effect from another. This strategy requires identification of an "instrument" – i.e. a variable which correlates with per capita income but not with the error term in the linear regression. However, since any variable which is likely to correlate with income is also likely to correlate strongly with health and life expectancy this is a difficult task. Some research suggests that in low and middle-income countries, the causality does indeed go from income to health, while the opposite is true for rich countries.