
 | ||
Parallel coordinates are a common way of visualizing high-dimensional geometry and analyzing multivariate data.
Contents
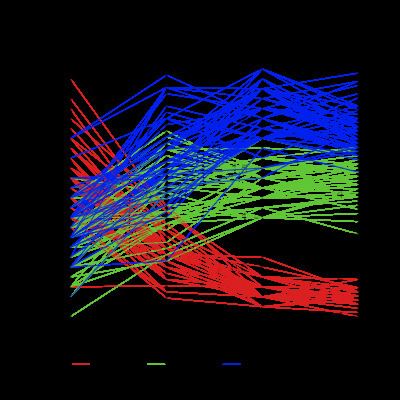
To show a set of points in an n-dimensional space, a backdrop is drawn consisting of n parallel lines, typically vertical and equally spaced. A point in n-dimensional space is represented as a polyline with vertices on the parallel axes; the position of the vertex on the i-th axis corresponds to the i-th coordinate of the point.
This visualization is closely related to time series visualization, except that it is applied to data where the axes do not correspond to points in time, and therefore do not have a natural order. Therefore, different axis arrangements may be of interest.
History
Parallel coordinates were often said to be invented by Philbert Maurice d'Ocagne (fr) in 1885, but even though the words "Coordonnées parallèles" appear in the book title this work has nothing to do with the visualization techniques of the same name (the book only describes a method of coordinate transformation, see fulltext PDF of the book by clicking the link in the references). But even before 1885, parallel coordinates were used, for example in Henry Gannetts "General Summary, Showing the Rank of States, by Ratios, 1880", or afterwards in Henry Gannetts "Rank of States and Territories in Population at Each Census, 1790-1890" in 1898. They were popularised again 79 years later by Alfred Inselberg in 1959 and systematically developed as a coordinate system starting from 1977. Some important applications are in collision avoidance algorithms for air traffic control (1987—3 USA patents), data mining (USA patent), computer vision (USA patent), Optimization, process control, more recently in intrusion detection and elsewhere.
Higher dimensions
Adding more dimensions in parallel coordinates (often abbreviated ||-coords or PCs) involves adding more axes. The value of parallel coordinates is that certain geometrical properties in high dimensions transform into easily seen 2D patterns. For example, a set of points on a line in n-space transforms to a set of polylines (or curves) in parallel coordinates all intersecting at n − 1 points. For n = 2 this yields a point-line duality pointing out why the mathematical foundations of parallel coordinates are developed in the Projective rather than Euclidean space. Also known are the patterns corresponding to (hyper)planes, curves, several smooth (hyper)surfaces, proximities, convexity and recently non-orientability. Since the process maps a k-dimensional data onto a lower 2D space, some loss of information is expected. The loss of information can be measured using Parseval's identity (or energy norm).
Statistical considerations
When used for statistical data visualisation there are three important considerations: the order, the rotation, and the scaling of the axes.
The order of the axes is critical for finding features, and in typical data analysis many reorderings will need to be tried. Some authors have come up with ordering heuristics which may create illuminating orderings.
The rotation of the axes is a translation in the parallel coordinates and if the lines intersected outside the parallel axes it can be translated between them by rotations. The simplest example of this is rotating the axis by 180 degrees.
Scaling is necessary because the plot is based on interpolation (linear combination) of consecutive pairs of variables. Therefore, the variables must be in common scale, and there are many scaling methods to be considered as part of data preparation process that can reveal more informative views.
A smooth parallel coordinate plot is achieved with splines. In the smooth plot, every observation is mapped into a parametric line (or curve), which is smooth, continuous on the axes, and orthogonal to each parallel axis. This design emphasizes the quantization level for each data attribute. If one uses the Fourier interpolation of degree equals to the data dimensionality, then an Andrews plot is achieved.
Reading
Inselberg (Inselberg 1997) made a full review of how to visually read out parallel coords' relational patterns. When most lines between two parallel axis are somewhat parallel to each others, that suggests a positive relationship between these two dimensions. When lines cross in a kind of superposition of X-shapes, that's negative relationship. When lines cross randomly or are parallel, that show there is no particular relationship.
Limitations
In parallel coordinates, each axis can have at most two neighboring axes (one on the left, and one on the right). For a d-dimensional data set, at most d-1 relationships can be shown at a time. In time series visualization, there exists a natural predecessor and successor; therefore in this special case, there exists a preferred arrangement. However when the axes do not have a unique order, finding a good axis arrangement requires the use of heuristics and experimentation. In order to explore more complex relationships, axes must be reordered.
By arranging the axes in 3-dimensional space (however, still in parallel, like nails in a nail bed), an axis can have more than two neighbors in a circle around the central attribute, and the arrangement problem gets easier (for example by using a minimum spanning tree). A prototype of this visualization is available as extension to the data mining software ELKI. However, the visualization is harder to interpret and interact with than a linear order.
Software
While there are a large number of papers about parallel coordinates, there are only few notable software publicly available to convert databases into parallel coordinates graphics. Notable software are ELKI, GGobi, Macrofocus High-D, Mondrian, Orange and ROOT. Libraries include Protovis.js, D3.js provide basic examples, while more complex examples are also available. D3.Parcoords.js (a D3-based library) and Macrofocus High-D API (a Java library) specifically dedicated to ||-coords graphic creation have also been published. The Python data structure and analysis library Pandas implements parallel coordinates plotting, using the plotting library matplotlib. The R package GGally, among others, implements parallel coordinates plotting.