
Website www.ggobi.org | License GNU GPL, BSD, CPL | |
 | ||
Developer Deborah Swayne, Michael Lawrence, Hadley Wickham, Duncan Temple Lang, Di Cook, Heike Hofmann and Andreas Buja Stable release 2.1.8 / August 12, 2008; 8 years ago (2008-08-12) | ||
GGobi is a free statistical software tool for interactive data visualization. GGobi allows extensive exploration of the data with Interactive dynamic graphics. It is also a tool for looking at multivariate data. R can be used in sync with GGobi (through rggobi). GGobi prides itself on its ability to link multiple graphs together.
Contents
Overview
GGobi was created to look at data matrices. The designers were interested in exploring multi-dimensional data. The program developers went through many name changes before settling on GGobi (A combination of the words GTK+ and the Gobi Desert). The original concept, Dataviewer, began in the mid-80s, and a predecessor, XGobi, began in 1989. Work began on the current version of GGobi in 1999. The main reason for the different versions was the change in technology.
Released under a combination of three free software licenses, GGobi is free software.
Importance of graphics
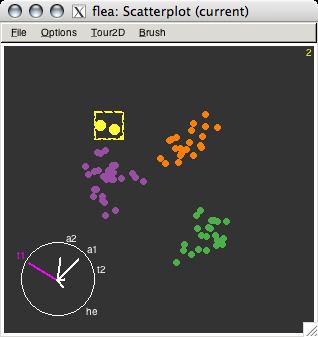
Looking at data through various graphs can reveal more information about the distribution than just looking at the numbers or a summary of them. Using the different tools within GGobi, clusters, non-linear distributions, outliers, and other important variations in the data can be discovered. GGobi is a program which allows exploratory data analysis to occur for multi-dimensional data.
Supported data sources
GGobi can read CSV and XML file types.
Types of graphics
Interactions
These tools can be used to pick out special points or clusters of data.