
 | ||
The oxygen–haemoglobin dissociation curve, also called the oxyhemoglobin dissociation curve or oxygen dissociation curve (ODC), is a curve that plots the proportion of hemoglobin in its saturated (oxygen-laden) form on the vertical axis against the prevailing oxygen tension on the horizontal axis. This curve is an important tool for understanding how our blood carries and releases oxygen. Specifically, the oxyhaemoglobin dissociation curve relates oxygen saturation (S2) and partial pressure of oxygen in the blood (P2), and is determined by what is called "haemoglobin affinity for oxygen"; that is, how readily hemoglobin acquires and releases oxygen molecules into the fluid that surrounds it.
Contents
Background
Hemoglobin (Hb), a globular protein, is the primary vehicle for transporting oxygen in the blood. Oxygen is also carried dissolved in the blood's plasma, but to a much lesser degree. Hemoglobin is contained in erythrocytes, more commonly referred to as red blood cells. Under certain conditions, oxygen bound to the hemoglobin is released into the blood's plasma and absorbed into the tissues. Each hemoglobin molecule has the capacity to carry four oxygen molecules. How much of that capacity is filled by oxygen at any time is called the oxygen saturation. Expressed as a percentage, the oxygen saturation is the ratio of the amount of oxygen bound to the hemoglobin, to the oxygen-carrying capacity of the hemoglobin. The oxygen-carrying capacity of hemoglobin is determined by the type of hemoglobin present in the blood. The amount of oxygen bound to the hemoglobin at any time is related, in large part, to the partial pressure of oxygen to which the hemoglobin is exposed. In the lungs, at the alveolar–capillary interface, the partial pressure of oxygen is typically high, and therefore the oxygen binds readily to hemoglobin that is present. As the blood circulates to other body tissue in which the partial pressure of oxygen is less, the hemoglobin releases the oxygen into the tissue because the hemoglobin cannot maintain its full bound capacity of oxygen in the presence of lower oxygen partial pressures.
Sigmoidal shape
The curve is usually best described by a sigmoid plot, using by a formula of the kind:
A hemoglobin molecule can bind up to four oxygen molecules in a reversible way.
The shape of the curve results from the interaction of bound oxygen molecules with incoming molecules. The binding of the first molecule is difficult. However, this facilitates the binding of the second, third and fourth, this is due to the induced conformational change in the structure of the haemoglobin molecule induced by the binding of an oxygen molecule.
In its most simple form, the oxyhemoglobin dissociation curve describes the relation between the partial pressure of oxygen (x axis) and the oxygen saturation (y axis). Hemoglobin's affinity for oxygen increases as successive molecules of oxygen bind. More molecules bind as the oxygen partial pressure increases until the maximum amount that can be bound is reached. As this limit is approached, very little additional binding occurs and the curve levels out as the hemoglobin becomes saturated with oxygen. Hence the curve has a sigmoidal or S-shape. At pressures above about 60 mmHg, the standard dissociation curve is relatively flat, which means that the oxygen content of the blood does not change significantly even with large increases in the oxygen partial pressure. To get more oxygen to the tissue would require blood transfusions to increase the hemoglobin count (and hence the oxygen-carrying capacity), or supplemental oxygen that would increase the oxygen dissolved in plasma. Although binding of oxygen to hemoglobin continues to some extent for pressures about 50 mmHg, as oxygen partial pressures decrease in this steep area of the curve, the oxygen is unloaded to peripheral tissue readily as the hemoglobin's affinity diminishes. The partial pressure of oxygen in the blood at which the hemoglobin is 50% saturated, typically about 26.6 mmHg (3.5 kPa) for a healthy person, is known as the P50. The P50 is a conventional measure of hemoglobin affinity for oxygen. In the presence of disease or other conditions that change the hemoglobin's oxygen affinity and, consequently, shift the curve to the right or left, the P50 changes accordingly. An increased P50 indicates a rightward shift of the standard curve, which means that a larger partial pressure is necessary to maintain a 50% oxygen saturation. This indicates a decreased affinity. Conversely, a lower P50 indicates a leftward shift and a higher affinity.
The 'plateau' portion of the oxyhemoglobin dissociation curve is the range that exists at the pulmonary capillaries (minimal reduction of oxygen transported until the p(O2) falls 50 mmHg).
The 'steep' portion of the oxyhemoglobin dissociation curve is the range that exists at the systemic capillaries (a small drop in systemic capillary p(O2) can result in the release of large amounts of oxygen for the metabolically active cells).
To see the relative affinities of each successive oxygen as you remove/add oxygen from/to the hemoglobin from the curve compare the relative increase/decrease in p(O2) needed for the corresponding increase/decrease in s(O2).
Factors that affect the standard dissociation curve
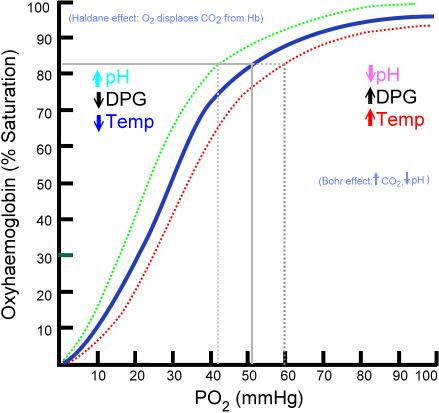
The strength with which oxygen binds to hemoglobin is affected by several factors. These factors shift or reshape the oxyhemoglobin dissociation curve. A rightward shift indicates that the hemoglobin under study has a decreased affinity for oxygen. This makes it more difficult for hemoglobin to bind to oxygen (requiring a higher partial pressure of oxygen to achieve the same oxygen saturation), but it makes it easier for the hemoglobin to release oxygen bound to it. The effect of this rightward shift of the curve increases the partial pressure of oxygen in the tissues when it is most needed, such as during exercise, or hemorrhagic shock. In contrast, the curve is shifted to the left by the opposite of these conditions. This leftward shift indicates that the hemoglobin under study has an increased affinity for oxygen so that hemoglobin binds oxygen more easily, but unloads it more reluctantly. Left shift of the curve is a sign of hemoglobin's increased affinity for oxygen (e.g. at the lungs). Similarly, right shift shows decreased affinity, as would appear with an increase in either body temperature, hydrogen ions, 2,3-bisphosphoglycerate (2,3-BPG) concentration or carbon dioxide concentration.
Note:
The causes of shift to right can be remembered using the mnemonic, "CADET, face Right!" for CO2, Acid, 2,3-DPG, Exercise and Temperature. Factors that move the oxygen dissociation curve to the right are those physiological states where tissues need more oxygen. For example, during exercise, muscles have a higher metabolic rate, and consequently need more oxygen, produce more carbon dioxide and lactic acid, and their temperature rises.
pH
A decrease in pH (increase in H+ ion concentration) shifts the standard curve to the right, while an increase shifts it to the left. This occurs because at greater H+ ion concentration, various amino acid residues, such as Histidine 146 exist predominantly in their protonated form allowing them to form ion pairs that stabilize deoxyhemoglobin in the T state. The T state has a lower affinity for oxygen than the R state, so with increased acidity, the hemoglobin binds less O2 for a given PO2 (and more H+). This is known as the Bohr effect. A reduction in the total binding capacity of hemoglobin to oxygen (i.e. shifting the curve down, not just to the right) due to reduced pH is called the root effect. This is seen in bony fish. The binding affinity of hemoglobin to O2 is greatest under a relatively high pH.
Carbon dioxide
Carbon dioxide affects the curve in two ways: first, CO2 accumulation causes carbamino compounds to be generated through chemical interactions, which bind to hemoglobin forming carbaminohemoglobin and second, it influences intracellular pH due to formation of bicarbonate ion. Formation of carbaminohemoglobin stabilizes T state hemoglobin by formation of ion pairs. Only about 5–10% of the total CO2 content of blood is transported as carbamino compounds, whereas (80–90%) is transported as bicarbonate ions and a small amount is dissolved in the plasma.The formation of a bicarbonate ion will release a proton into the plasma, increasing acidity which also shifts the curve to the right as discussed above; low CO2 levels in the blood stream results in a high pH, and thus provides more optimal binding conditions for hemoglobin and O2.
2,3-BPG
2,3-Bisphosphoglycerate or 2,3-BPG (formerly named 2,3-diphosphoglycerate or 2,3-DPG, which is now considered obsolete and incorrect) is an organophosphate formed in erythrocytes during glycolysis and is the conjugate base of 2,3-bisphosphoglyceric acid. The production of 2,3-BPG is likely an important adaptive mechanism, because the production increases for several conditions in the presence of diminished peripheral tissue O2 availability, such as hypoxaemia, chronic lung disease, anaemia, and congestive heart failure, among others. High levels of 2,3-BPG shift the curve to the right (as in childhood), while low levels of 2,3-BPG cause a leftward shift, seen in states such as septic shock, and hypophosphataemia. In the absence of 2,3-BPG, hemoglobin's affinity for oxygen increases. 2,3-BPG acts as a heteroallosteric effector of hemoglobin, lowering hemoglobin's affinity for oxygen by binding preferentially to deoxyhemoglobin. An increased concentration of BPG in red blood cells favours formation of the T, low-affinity state of hemoglobin and so the oxygen-binding curve will shift to the right.
Temperature
Increase in temperature shifts the ODC to the right due to two reasons. Firstly, if temperature increases with constant concentration of oxygen, then the partial pressure of oxygen increases. Hence, the oxygen saturation almost remains the same for a higher partial pressure of oxygen causing the curve to shift to the right. Secondly, the oxygen saturation is slightly less even for the same concentration of oxygen at a higher temperature due to the fact that the increase in temperature(t) will weaken and denature the bond between an oxygen and a hemoglobin which in turn decreases the concentration of the oxyhemoglobin. Both the factors, cause rightward shift of the ODC.
Carbon monoxide
Hemoglobin binds with carbon monoxide 200–250 times more readily than with oxygen. Because of this higher affinity of hemoglobin for carbon monoxide than for oxygen, carbon monoxide is a highly successful competitor that will displace oxygen even at minuscule partial pressures. The reaction HbO2 + CO → HbCO + O2 irreversibly displaces the oxygen molecules forming carboxyhemoglobin; the binding of the carbon monoxide to the iron centre of haemoglobin is much stronger than that of oxygen, and the binding site remains blocked for the remainder of the life cycle of that effected red blood cell. With an increased level of carbon monoxide, a person can suffer from severe tissue hypoxia while maintaining a normal pO2 because carboxyhaemoglobin does not carry oxygen to the tissues.
Effects of methemoglobinaemia
Methemoglobinaemia is a form of abnormal hemoglobin where the iron centre has been oxidised from the +2 oxidation state (the normal form) to the +3 state. This causes a rightward shift in the curve as oxygenated methemoglobin (oxymethemoglobin) does not unload O2. However, methemoglobin has increased rbc affinity for cyanide, and is therefore useful in the treatment of cyanide poisoning. In cases of accidental ingestion, administration of a nitrite (such as amyl nitrite) can be used to deliberately oxidise hemoglobin and raise methemoglobin levels, restoring the functioning of cytochrome oxidase. The nitrite also acts as a vasodilator, promoting the cellular supply of oxygen, and the addition of an iron salt provides for competitive binding of the free cyanide as the biochemically inert hexacyanoferrate(III) ion, [Fe(CN)6]3−. An alternative approach involves administering thiosulfate, thereby converting cyanide to thiocyanate, SCN−, which is excreted via the kidneys. Methemoglobin is also formed in small quantities when the dissociation of oxyhemoglobin results in the formation of methemoglobin and superoxide, O2−, instead of the usual products. Superoxide is a free radical and causes biochemical damage, but is neutralised by the action of the enzyme superoxide dismutase.
Fetal hemoglobin
Fetal hemoglobin (HbF) is structurally different from normal adult hemoglobin (HbA), giving HbF a higher affinity for oxygen than HbA. HbF is composed of two alpha and two gamma chains whereas HbA is composed of two alpha and two beta chains. The fetal dissociation curve is shifted to the left relative to the curve for the normal adult because of these structural differences.
Typically, fetal arterial oxygen pressures are lower than adult arterial oxygen pressures. Hence higher affinity to bind oxygen is required at lower levels of partial pressure in the fetus to allow diffusion of oxygen across the placenta. At the placenta, there is a higher concentration of 2,3-BPG formed, and 2,3-BPG binds readily to beta chains rather than to alpha chains. As a result, 2,3-BPG binds more strongly to adult hemoglobin, causing HbA to release more oxygen for uptake by the fetus, whose HbF is unaffected by the 2,3-BPG. HbF then delivers that bound oxygen to tissues that have even lower partial pressures where it can be released.