
 | ||
Similar Water point mapping, Water supply, Water metering | ||
The top three steps to reducing non revenue water
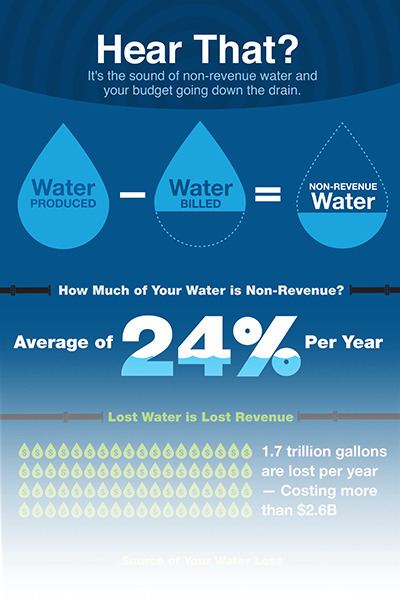
Non revenue water (NRW) is water that has been produced and is “lost” before it reaches the customer. Losses can be real losses (through leaks, sometimes also referred to as physical losses) or apparent losses (for example through theft or metering inaccuracies). High levels of NRW are detrimental to the financial viability of water utilities, as well to the quality of water itself. NRW is typically measured as the volume of water "lost" as a share of net water produced. However, it is sometimes also expressed as the volume of water “lost” per km of water distribution network per day.
Contents
- The top three steps to reducing non revenue water
- NRW components and audits
- NRW indicators
- Expressed as a share of produced water
- Expressed in cubic meters per network length
- Benefits of NRW reduction
- Programs to reduce NRW
- Successful programs
- Pitfalls of programs
- Optimal level of NRW
- References
NRW components and audits
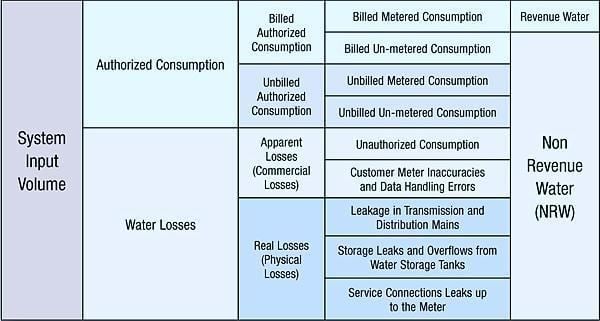
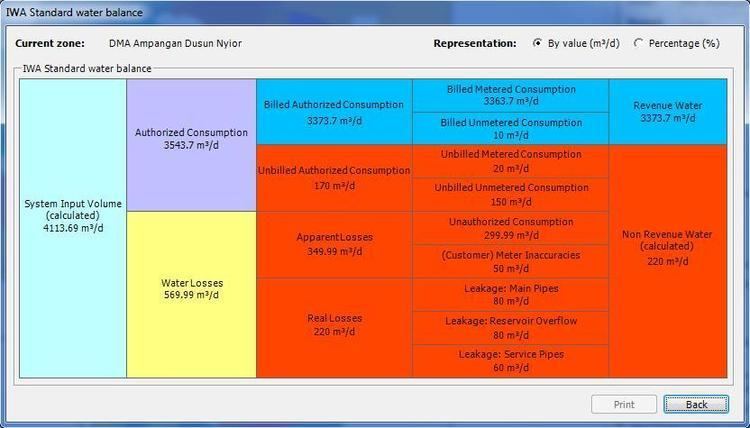
The International Water Association (IWA) has developed a detailed methodology to assess the various components of NRW. Accordingly, NRW has the following components:
In many utilities the exact breakdown of NRW components and sub-components is simply not known, making it difficult to decide about the best course of action to reduce NRW. Metering of water use at the level of production (wells, bulk Water supply), at key points in the distribution network and for consumers is essential to estimate levels of NRW (see Water metering).

In most developed countries, there are no or very limited apparent losses. For developing countries the World Bank has estimated that, on average, apparent losses - in particular theft through illegal connections - account for about 40% of NRW. In some cities, apparent losses can be higher than real losses. Reducing apparent losses from illegal connections is often beyond what a utility can achieve by itself, because it requires a high level of political support. Illegal connections are often in slums, which means that their regularization in some cases particularly affects the poor. A water audit is a key tool to assess the breakdown of NRW and to develop a program for NRW reduction. Often a distinction is made between unvalidated and validated water audits. Unvalidated water audits are desktop studies that include many estimates and their results can have an error range for real losses of +/- 50% or more. Its main value is to identify where it is necessary to reduce the uncertainty of the water audit through validation. Validating water audits is a complex process that involves testing of production water meters, testing of a representative random sample of customer meters, eliminating systematic errors created through the billing process and validating the number of illegal connections through aerial mapping, field surveys or cross-references between various existing databases. In developing countries it is rare to find utilities that have undertaken validated water audits, and even in developed countries they are not systematically used. The American Water Works Association (AWWA) has developed Water Audit Software which allows utilities to rate the overall degree of validity of their water audit data. Guidance on loss control planning is given based upon the credibility of the data and the measure of losses displayed by the water audit.
NRW is sometimes also referred to as unaccounted-for water (UFW). While the two terms are similar, they are not identical, since non-revenue water includes authorized unbilled consumption (e.g. for firefighting or, in some countries, for use by religious institutions) while unaccounted-for water excludes it.
NRW indicators
The most commonly used indicator to measure NRW is the percentage of NRW as a share of water produced. While this indicator is easy to understand and indeed has been widely used, it has increasingly been recognized that it is not an appropriate indicator to benchmark NRW levels between utilities or even to monitor changes over time. When losses in terms of absolute volume are constant the percentage of NRW varies greatly with total water use, i.e. if water use increases and the volume of losses remains constant the percentage of NRW declines. This problem can be eliminated by measuring NRW not as a share, but in terms of absolute losses per connection per day, as recommended by the International Water Association (IWA). Nevertheless, the use of percentage figures to compare levels of NRW remains common despite its shortcomings. The International Benchmarking Network for Water and Sanitation recommends to use different indicators (percentage, losses per connection or losses per km of network) together. Losses per kilometer of network are more appropriate to benchmark real losses, while losses per connection are more appropriate to benchmark apparent losses.
The concept of NRW as an indicator to compare real losses of water utilities has been criticized as flawed, particularly because real losses depend to some extent on factors largely outside the control of the utility, such as topography, age of network, length of network per connection and water use per capita. As an alternative indicator for the measurement of real losses an Infrastructure Leakage Index (ILI) has been developed. The ILI is defined as the ratio of Current Annual Real Losses (CARL) to Unavoidable Annual Real Losses (UARL).
Expressed as a share of produced water
The following percentages indicate the share of NRW in total water produced:
Expressed in cubic meters per network length
The following figures are expressed in cubic meters per kilometer of distribution network per day:
These levels are given per km of network, not per connection.
Benefits of NRW reduction
The World Bank has estimated the total cost of NRW to utilities worldwide at US$14 billion per year. Reducing by half the current levels of losses in developing countries, where relative losses are highest, could generate an estimated US$2.9 billion in cash and serve an additional 90 million people.
Benefits of NRW reduction, in particular of leakage reduction, include
Leakage reduction may also be an opportunity to improve relations with the public and employees. A leak detection program may be highly visible, encouraging people to think about water conservation. The reduction of commercial losses, while politically and socially challenging, can also improve relations with the public, since some consumers may be reluctant to pay their water bills knowing that many others use services without being billed or being underbilled.
In the specific context of the United States NRW reduction can also mean reduced legal liability and reduced insurance payments.
Programs to reduce NRW
Reducing NRW is a complex process. While some programs have been successful, there are many pitfalls.
Successful programs
In the following cities high levels of non-revenue water have been susbtantially reduced:
These successes were achieved by both public and private utilities, in every continent, in emerging countries as well as very poor countries, in large cities and smaller towns. All required a long-term commitment by utility management and the government - local or national - over a period of at least four years.
Pitfalls of programs
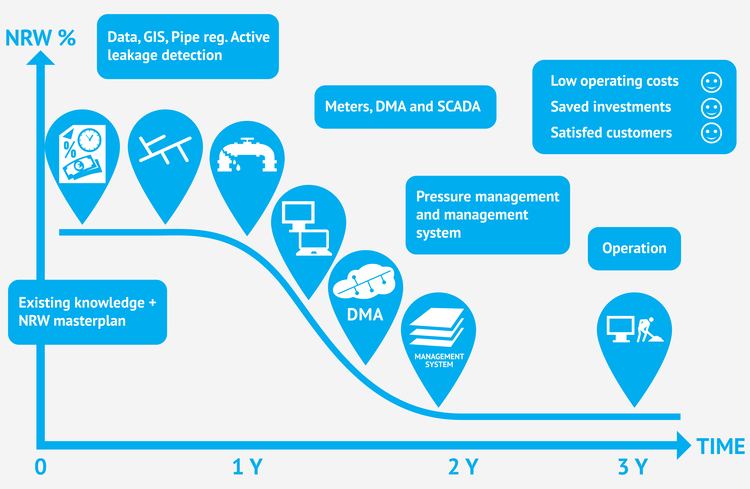
Many programs to reduce NRW have failed to achieve their objectives, sometimes from the onset and sometimes only in the long run. Often they focus on real losses without sufficient attention being paid to apparent losses. If programs achieve an initial reduction in NRW levels, they often increase again over the years to the same or even higher levels than before the program. Both apparent and real losses have a natural tendency to increase if nothing is done: more leakage will occur, there will be more defective meters, and information on customers and networks will become more outdated. In order to sustain NRW at low levels, investments in fixing leaks and replacing meters are insufficient in the best case and ineffective in the worst case. To achieve permanent results, management procedures related to a utility's organization, precedures and human resources have to be changed. Additionally the implementation of an Intelligent Pressure management system is an efficient approach to reduce the total real losses in the long term. It is one of the most basic and lucrative forms of optimizing a system and generally provides fast investment paybacks.
According to a study by the World Bank some of the reasons why NRW levels in developing countries have not been reduced significantly are the following.
Another source quotes the seven most frequent reasons for failure of NRW reduction programs as follows:
Optimal level of NRW?
There is some debate as to what is an economically optimal level of leakage or, speaking more broadly, of NRW. From a financial or economic point of view it is not appropriate to try to reduce NRW to the lowest possible level, because the marginal cost of reducing NRW increases once the cheaper options have been exploited. Once the marginal cost of reducing NRW exceeds the marginal benefits or water savings, an economic optimum has been achieved. Benefits should be measured through reduced production costs if reduction of NRW results in lower water production, through the avoided costs of additional supply capacity if the system is close to the limit of its capacity and demand is growing, or through the value of water sold if reduction of NRW results in additional water sales. The latter can be done by valuing water through water tariffs (financial value) or through the willingness to pay by customers (economic value). There are fewer financial incentives for a utility to reduce NRW if water production is cheap, if there is no or little metering (so that revenues thus are independent of actual consumption), or if volumetric tariffs are low.
In the United Kingdom the assessment of economic levels of leakage has a long history. The first national study on the topic was published in 1980 setting down a methodology for the assessment of economic leakage levels. This led to the implementation of sectors (District Metered Areas) in most water companies in the UK. The findings were reported in a major national research program in 1994. As a result of a drought in 1995/96 a number of companies initiated major leakage management programmes based on economic assessments. The situation in other parts of the world is quite different from the UK. Particularly in developing countries sectorisation is very rare and proactive leakage control limited. The benefits of pressure management are not widely appreciated and there is generally no assessment of the economic level of leakage.
From a public health and drinking water quality point of view it is being argued that the level of real water losses should be as low as possible, independently of economic or financial considerations, in order to minimize the risk of drinking water contamination in the distribution network.
The World Bank recommends that NRW should be "less than 25%", while the Chilean water regulator SISS has determined a NRW level of 15% as optimal in its model of an efficient water company that it uses to benchmark service providers. In England and Wales NRW stands at 19% or 149 liter/property/day.
In the United States the American Water Works Association's (AWWA) Water Loss Control Committee recommended in 2009 that water utilities conduct annual water audits as a standard business practice. AWWA recommends that water utilities should track volumes of apparent and real losses and the annual cost impacts of these losses. Utilities should then seek to control excessive losses to levels that are economic for the water utility. In 1999 the California Urban Water Conservation Council identified a 10 percent benchmark for non-revenue water.