National League 2 South (known before September 2009 as National Division Three South) is a level four league in the English rugby union system. It is one of two leagues at this level, with its counterpart, National League 2 North, covering the north of England. The format of the league was changed at the beginning of the 2009–10 season following reorganisation by the Rugby Football Union.
The champions are promoted to National League 1. The runners-up play in a promotion play-off with the runners-up of National League 2 North; the team with the best record having home advantage. The bottom three teams are relegated, to either National League 3 South-West or National League 3 London & SE.
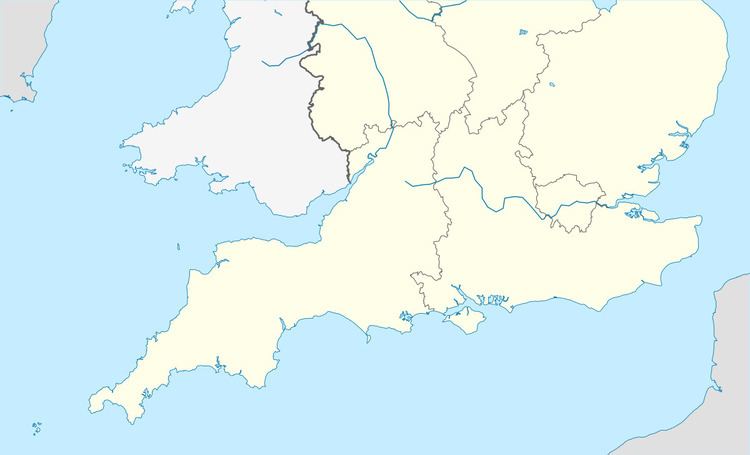
Participating teams and locations
Eleven of the teams listed below participated in the 2015–16 National League 2 South season; Henley Hawks and Cinderford were relegated from the 2015–16 National League 1 while London Irish Wild Geese were promoted as champions of National League 3 London & SE and Exmouth (champions) and Barnstaple (playoffs) from National League 3 South West. This season would also see Old Elthamians move from the 500 capacity Queen Mary Sports Ground in Chiselhurst to College Meadow in Eltham.
Current standings
NotesSince the 2000–01 season there has been a promotion play-off between the league runners-up of National League 2 North and National League 2 South for the third and final promotion place to National League 1. The team with the superior league record has home advantage. As of the end of the 2015–16 season the southern teams have been more successful with 11 wins to the northern teams 4.
Note that all records are from 1996-97 season onwards as this is widely held as the dawn of professionalism across the English club game. It also offers a better comparison between seasons as the division team numbers are roughly equal (for example when league rugby union first started in 1987-88 the southern league had only 11 teams playing 10 games each, compared to 14 teams in 1996-97 playing 26 games (home & away), going up to 16 teams in 2009-10 playing 30 games each). Attendance records are from 2000 onwards unless otherwise specified. All records are up to date up till the end of the 2015-16 season.
Most titles: 2, Barking (2004-05, 2009-10), Henley Hawks (2012-13, 2014-15), Cambridge (2005-06, 2015-16)Most times promoted from division: 3, Henley Hawks (1997–98, 2012-13, 2014-15)Most times relegated from division: 3, Havant (1998–99, 2002-03, 2008-09)Most league points in a season: 132, Ealing Trailfinders (2010-11)Least league points in a season: 0, Metropolitan Police (1999-00), Camberley (2002-03)Most points scored in a season: 1,490, Ealing Trailfinders (2010-11)Least points scored in a season: 270, Camberley (2002-03)Most points conceded in a season: 2,055, Newbury Blues (2010-11)Least points conceded in a season: 240, Plymouth Albion (2000-01)Best points difference (For/Against): 1,066, Ealing Trailfinders (2010-11)Worst points difference (For/Against): -1,676, Newbury Blues (2010-11)Most games won in a season: 27, Ealing Trailfinders and Jersey (both 2010-11)Most games lost in a season: 29, Newbury Blues (2010-11), Launceston (2015-16)Most games drawn in a season: 4, Rugby Lions (2008-09), Barnes (2015-16)Most bonus points in a season: 30, Bishop's Stortford (2014-15)Largest home win: 132 - 0 Old Albanian at home to Newbury Blues on 26 March 2011 (2010-11)Largest away win: 85 - 3, Henley Hawks away to Barking on 27 October 2012 (2012-13)Most points scored in a match: 132, Old Albanian at home to Newbury Blues on 26 March 2011 (2010-11)Most tries scored in a match: 20, Jersey at home to Newbury Blues on 6 November 2011, Ealing Trailfinders at home to Hinckley on 12 March 2011, Old Albanian at home to Newbury Blues on 26 March 2011 (all 2010-11)Most conversions scored in a match: 16, Old Albanian at home to Newbury Blues on 26 March 2011, Ealing Trailfinders at home to Lydney on 30 April 2011 (both 2010-11)Most penalties scored in a match: 7, Blackheath at home to Redruth on 14 December 2002 (2002-03), Hertford at home to Rosslyn Park on 30 September 2006 and Clifton at home to Lydney on 21 October 2006 (both 2006-07), Dings Crusaders at home to Southend on 6 November 2011 (2010-11), Launceston at home to Hartpury College on 28 September 2013 (2013-14), Launceston away to Dings Crusaders on 27 September 2014 (2014-15)Most drop kicks scored in a match: 3, Westcombe Park at home to Ealing Trailfinders on 5 December 2009 (2009-10)Most times top points scorer: 2, Nat Saumi for Penzance & Newlyn (2000-01, 2001-02), Adam Westall for Lydney (2002-03, 2004-05), Andy Frost for Southend (2005-06, 2006-07), Gary Kingdom for Taunton Titans (2014-15, 2015-16)Most times top try scorer: 2, Phil Chesters for Ealing Trailfinders (2009-10, 2010-11), Ian Clark for Hartpury College (2011-12, 2012-13)Most points in a season: 374, Nat Saumi for Penzance & Newlyn (2000-01)Most tries in a season: 70, Phil Chesters for Ealing Trailfinders (2010-11))Most points in a match: 45, Adam Westall for Lydney away to Haywards Heath on 12 March 2005 (2004-05)Most tries in a match: 7, James O'Brien for Old Patesians at home to Old Colfeians on 27 March 2004 (2003-04), Phil Chesters for Ealing Trailfinders at home to Newbury Blues on 2 October 2010 and at home to Lydney on 30 April 2011)Most conversions in a match: 16, Richard Gregg for Old Albanian at home to Newbury Blues on 26 March 2011 (2010-11)Most penalties in a match: 7, Jonathan Griffin for Blackheath at home to Redruth on 14 December 2002 (2002-03), Kieron Davies for Hertford at home to Rosslyn Park on 30 September 2006 and John Barnes for Clifton at home to Lydney on 21 October 2006 (both 2006-07), Mitch Burton for Dings Crusaders at home to Southend on 6 November 2011 (2010-11), Luke Cozens for Hartpury College away to Dings Crusaders on 17 November 2012 and Danial Trigg for Dings Crusaders away to Lydney on 1 December 2012 (both 2012-13), Kieron Lewitt for Launceston away to Dings Crusaders on 27 September 2014 (2014-15)Most drop kicks in a match: 3, Lee Audis for Westcombe Park at home to Ealing Trailfinders on 5 December 2009 (2009-10)Highest attendance (league game): 3,270, Henley Hawks at home to Worthing Raiders on 4 May 2013 (2012-13)Lowest attendance (league game): 30, Barnes at home to Shelford on 20 February 2010 (2009-10)Highest attendance (promotion playoff): 4,000, Redruth at home to Macclesfield on 1 May 2005 (2004-05)Lowest attendance (promotion playoff): 473, Old Albanian at home to Sedgley Park on 14 May 2016 (2015–16)Highest average attendance (club): 1,281, Plymouth Albion (2000-01)Lowest average attendance (club): 96, Old Patesians (2006-07)Highest average attendance (season): 573 (2000-01)Lowest average attendance (season): 292 (2009-10)As of the end of the games of 30 April 2016. Stats taken from 1998-99 season onwards and include regular league games only in National League 2 South (no promotion playoff games). Points scored includes tries, drop kicks, penalties and conversions.(Bold denotes players still playing in National League 2 South)
As of the end of the games of 30 April 2016. Stats taken from 1998-99 season onwards and include regular league games only in National League 2 South (no promotion playoff games).(Bold denotes players still playing in National League 2 South)