 | ||
In UNIX computing, the system load is a measure of the amount of computational work that a computer system performs. The load average represents the average system load over a period of time. It conventionally appears in the form of three numbers which represent the system load during the last one-, five-, and fifteen-minute periods.
Contents
Unix-style load calculation
All Unix and Unix-like systems generate a metric of three "load average" numbers in the kernel. Users can easily query the current result from a Unix shell by running the uptime command:
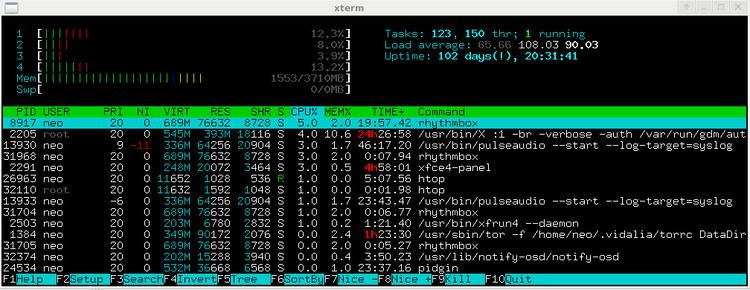
$ uptime 14:34:03 up 10:43, 4 users, load average: 0.06, 0.11, 0.09The w and top commands show the same three load average numbers, as do a range of graphical user interface utilities. In GNU/Linux, they can also be accessed by reading the /proc/loadavg file.
An idle computer has a load number of 0. Each process using or waiting for CPU (the ready queue or run queue) increments the load number by 1. Most UNIX systems count only processes in the running (on CPU) or runnable (waiting for CPU) states. However, Linux also includes processes in uninterruptible sleep states (usually waiting for disk activity), which can lead to markedly different results if many processes remain blocked in I/O due to a busy or stalled I/O system. This, for example, includes processes blocking due to an NFS server failure or too slow media (e.g., USB 1.x storage devices). Such circumstances can result in an elevated load average, which does not reflect an actual increase in CPU use (but still gives an idea on how long users have to wait).
Systems calculate the load average as the exponentially damped/weighted moving average of the load number. The three values of load average refer to the past one, five, and fifteen minutes of system operation.
Mathematically speaking, all three values always average all the system load since the system started up. They all decay exponentially, but they decay at different speed: they decay exponentially by e after 1, 5, and 15 minutes respectively. Hence, the 1-minute load average will add up 63% (more precisely: 1 - 1/e) of the load from last minute, plus 37% (1/e) of the load since start up excluding the last minute. For the 5 and 15 minute load average, the same 63%/37% ratio is computed throughout 5 minutes, and 15 minutes respectively. Therefore, it's not technically accurate that the 1-minute load average only includes the last 60 seconds activity (since it still includes 37% activity from the past), but that includes mostly the last minute.
For single-CPU systems that are CPU bound, one can think of load average as a percentage of system utilization during the respective time period. For systems with multiple CPUs, one must divide the number by the number of processors in order to get a comparable percentage.
For example, one can interpret a load average of "1.73 0.60 7.98" on a single-CPU system as:
This means that this system (CPU, disk, memory, etc.) could have handled all of the work scheduled for the last minute if it were 1.73 times as fast.
In a system with four CPUs, a load average of 3.73 would indicate that there were, on average, 3.73 processes ready to run, and each one could be scheduled into a CPU.
On modern UNIX systems, the treatment of threading with respect to load averages varies. Some systems treat threads as processes for the purposes of load average calculation: each thread waiting to run will add 1 to the load. However, other systems, especially systems implementing so-called M:N threading, use different strategies, such as counting the process exactly once for the purpose of load (regardless of the number of threads), or counting only threads currently exposed by the user-thread scheduler to the kernel, which may depend on the level of concurrency set on the process. Linux appears to count each thread separately as adding 1 to the load.
CPU load vs CPU utilization
The comparative study of different load indices carried out by Ferrari et al. reported that CPU load information based upon the CPU queue length does much better in load balancing compared to CPU utilization. The reason CPU queue length did better is probably because when a host is heavily loaded, its CPU utilization is likely to be close to 100% and it is unable to reflect the exact load level of the utilization. In contrast, CPU queue lengths can directly reflect the amount of load on a CPU. As an example, two systems, one with 3 and the other with 6 processes in the queue, are both very likely to have utilizations close to 100% although they obviously differ.
Reckoning CPU load
On Linux systems, the load-average is not calculated on each clock tick, but driven by a variable value that is based on the Hz frequency setting and tested on each clock tick. (Hz variable is the pulse rate of particular Linux kernel activity. 1 Hz is equal to one clock tick; 10ms by default.) Although the Hz value can be configured in some versions of the kernel, it is normally set to 100. The calculation code uses the Hz value to determine the CPU Load calculation frequency. Specifically, the timer.c::calc_load() function will run the algorithm every 5 * Hz, or roughly every five seconds. Following is that function in its entirety:
The countdown is over a LOAD_FREQ of 5 Hz.
The avenrun array contains 1-minute, 5-minute and 15-minute average. The CALC_LOAD macro and its associated values are defined in sched.h :
Other system performance commands
Other commands for assessing system performance include:
