
 | ||
The Hubbert Linearization is a way to plot production data to estimate two important parameters of a Hubbert curve; the logistic growth rate and the quantity of the resource that will be ultimately recovered. The Hubbert curve is the first derivative of a Logistic function, which has been used in modeling depletion of crude oil, predicting the Hubbert peak, population growth predictions and the depletion of finite mineral resources. The technique was introduced by Marion King Hubbert in his 1982 review paper. The geologist Kenneth S. Deffeyes applied this technique in 2005 to make a prediction about the peak production of conventional oil.
Contents
Principle
The first step of the Hubbert linearization consists of plotting the production data (P) as a fraction of the cumulative production (Q) on the vertical axis and the cumulative production on the horizontal axis. This representation exploits the linear property of the logistic differential equation:
where K and URR are the logistic growth rate and the Ultimate Recoverable Resource respectively. We can rewrite (1) as the following:
The above relation is a line equation in the P/Q versus Q plane. Consequently, a linear regression on the data points gives us an estimate of the slope and intercept from which we can derive the Hubbert curve parameters:
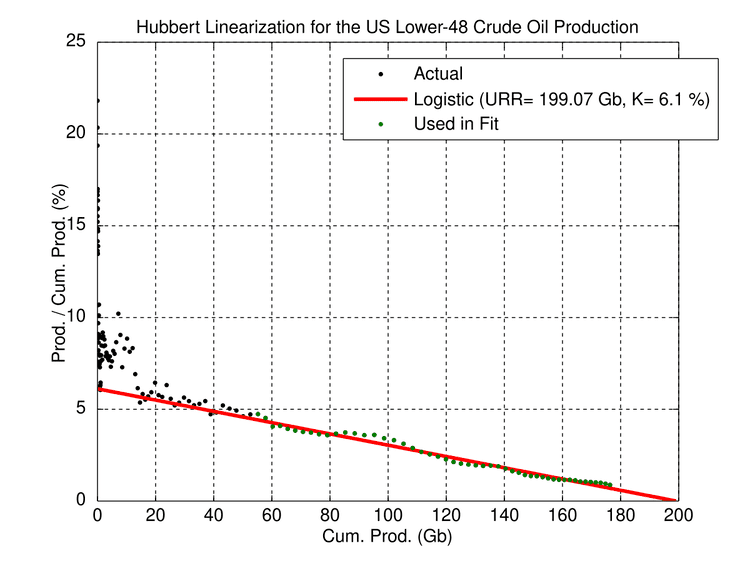
US oil production
The chart on the right gives an example of the application of the Hubbert Linearization technique in the case of the US Lower-48 oil production. The fit of a line using the data points from 1956 to 2005 (in green) gives a URR of 199 Gb and a logistic growth rate of 6%.
Second Hubbert linearization
The Hubbert linearization principle can be extended to the second derivatives by computing the derivative of (2):
the left term is often called the decline rate.
Hubbert parabola
This representation was proposed by Roberto Canogar and applied to the oil depletion problem: