
District Thierstein Elevation 662 m Population 925 (31 Dec 2008) | SFOS number 2618 Local time Saturday 10:33 PM Postal code 4204 | |
 | ||
Website www.himmelried.ch SFSO statistics Weather 4°C, Wind S at 5 km/h, 68% Humidity | ||
Himmelried is a municipality in the district of Thierstein in the canton of Solothurn in Switzerland.
Contents
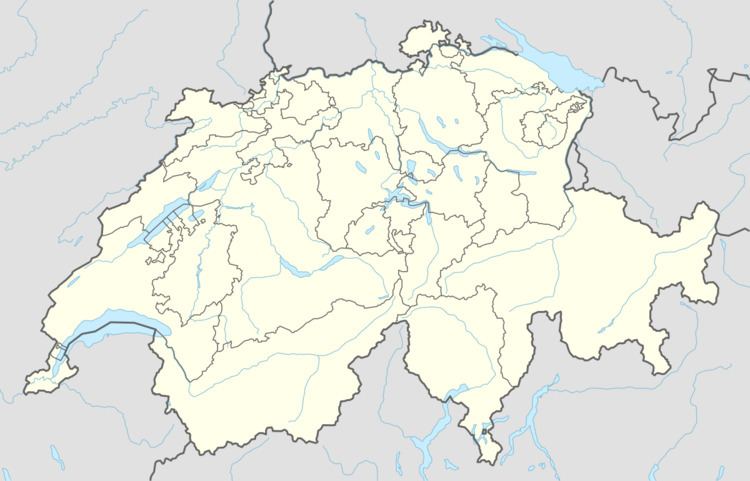
- Map of 4204 Himmelried Switzerland
- History
- Geography
- Coat of arms
- Demographics
- Heritage sites of national significance
- Politics
- Economy
- Religion
- Education
- References
Map of 4204 Himmelried, Switzerland
History
Himmelried is first mentioned in 1288 as in villa Heimenriet.
Geography
Himmelried has an area, as of 2009, of 6 square kilometers (2.3 sq mi). Of this area, 1.84 km2 (0.71 sq mi) or 30.7% is used for agricultural purposes, while 3.5 km2 (1.4 sq mi) or 58.3% is forested. Of the rest of the land, 0.64 km2 (0.25 sq mi) or 10.7% is settled (buildings or roads), 0.01 km2 (2.5 acres) or 0.2% is either rivers or lakes and 0.01 km2 (2.5 acres) or 0.2% is unproductive land.
Of the built up area, housing and buildings made up 7.0% and transportation infrastructure made up 3.3%. Out of the forested land, 56.3% of the total land area is heavily forested and 2.0% is covered with orchards or small clusters of trees. Of the agricultural land, 4.8% is used for growing crops and 24.0% is pastures, while 1.8% is used for orchards or vine crops. All the water in the municipality is flowing water.
The municipality is located in the Thierstein district, on the southern slope of Homberg mountain and above the Kaltbrunnen valley. It consists of the village of Himmelried and the hamlets of Steffen, Baumgarten and Schindelboden as well as scattered farm houses.
Coat of arms
The blazon of the municipal coat of arms is Argent a Juniper Tree Vert issuant from a Mount of the same between two Mullets Gules.
Demographics
Himmelried has a population (as of December 2015) of 930. As of 2008, 8.2% of the population are resident foreign nationals. Over the last 10 years (1999–2009 ) the population has changed at a rate of -4.7%. It has changed at a rate of -4.2% due to migration and at a rate of 1.3% due to births and deaths.
Most of the population (as of 2000) speaks German (898 or 94.9%), with French being second most common (11 or 1.2%) and English being third (9 or 1.0%).
As of 2008, the gender distribution of the population was 51.3% male and 48.7% female. The population was made up of 426 Swiss men (45.1% of the population) and 58 (6.1%) non-Swiss men. There were 416 Swiss women (44.1%) and 44 (4.7%) non-Swiss women. Of the population in the municipality 283 or about 29.9% were born in Himmelried and lived there in 2000. There were 108 or 11.4% who were born in the same canton, while 430 or 45.5% were born somewhere else in Switzerland, and 104 or 11.0% were born outside of Switzerland.
In 2008 there were 6 live births to Swiss citizens and were 5 deaths of Swiss citizens and 1 non-Swiss citizen death. Ignoring immigration and emigration, the population of Swiss citizens increased by 1 while the foreign population decreased by 1. There was 1 Swiss man and 2 Swiss women who emigrated from Switzerland. At the same time, there was 1 non-Swiss woman who emigrated from Switzerland to another country. The total Swiss population change in 2008 (from all sources, including moves across municipal borders) was a decrease of 34 and the non-Swiss population decreased by 3 people. This represents a population growth rate of -3.8%.
The age distribution, as of 2000, in Himmelried is; 57 children or 6.0% of the population are between 0 and 6 years old and 164 teenagers or 17.3% are between 7 and 19. Of the adult population, 47 people or 5.0% of the population are between 20 and 24 years old. 318 people or 33.6% are between 25 and 44, and 258 people or 27.3% are between 45 and 64. The senior population distribution is 81 people or 8.6% of the population are between 65 and 79 years old and there are 21 people or 2.2% who are over 80.
As of 2000, there were 385 people who were single and never married in the municipality. There were 463 married individuals, 38 widows or widowers and 60 individuals who are divorced.
As of 2000, there were 381 private households in the municipality, and an average of 2.5 persons per household. There were 104 households that consist of only one person and 26 households with five or more people. Out of a total of 386 households that answered this question, 26.9% were households made up of just one person and there were 2 adults who lived with their parents. Of the rest of the households, there are 122 married couples without children, 139 married couples with children There were 11 single parents with a child or children. There were 3 households that were made up of unrelated people and 5 households that were made up of some sort of institution or another collective housing.
In 2000 there were 248 single family homes (or 75.8% of the total) out of a total of 327 inhabited buildings. There were 36 multi-family buildings (11.0%), along with 36 multi-purpose buildings that were mostly used for housing (11.0%) and 7 other use buildings (commercial or industrial) that also had some housing (2.1%). Of the single family homes 20 were built before 1919, while 52 were built between 1990 and 2000. The greatest number of single family homes (60) were built between 1981 and 1990.
In 2000 there were 414 apartments in the municipality. The most common apartment size was 5 rooms of which there were 111. There were 9 single room apartments and 206 apartments with five or more rooms. Of these apartments, a total of 369 apartments (89.1% of the total) were permanently occupied, while 36 apartments (8.7%) were seasonally occupied and 9 apartments (2.2%) were empty. As of 2009, the construction rate of new housing units was 4.3 new units per 1000 residents. The vacancy rate for the municipality, in 2010, was 0.46%.
The historical population is given in the following chart:
Heritage sites of national significance
The Kastelhöhle, a paleolithic cave is listed as a Swiss heritage site of national significance.
Politics
In the 2007 federal election the most popular party was the SVP which received 29.14% of the vote. The next three most popular parties were the CVP (20.28%), the FDP (18.72%) and the SP (16.86%). In the federal election, a total of 344 votes were cast, and the voter turnout was 46.7%.
Economy
As of 2010, Himmelried had an unemployment rate of 2%. As of 2008, there were 35 people employed in the primary economic sector and about 18 businesses involved in this sector. 12 people were employed in the secondary sector and there were 3 businesses in this sector. 47 people were employed in the tertiary sector, with 24 businesses in this sector. There were 534 residents of the municipality who were employed in some capacity, of which females made up 40.1% of the workforce.
In 2008 the total number of full-time equivalent jobs was 66. The number of jobs in the primary sector was 18, all of which were in agriculture. The number of jobs in the secondary sector was 9 of which 8 or (88.9%) were in manufacturing and 1 was in construction. The number of jobs in the tertiary sector was 39. In the tertiary sector; 7 or 17.9% were in wholesale or retail sales or the repair of motor vehicles, 1 was in the information industry, 12 or 30.8% were technical professionals or scientists, 7 or 17.9% were in education.
In 2000, there were 16 workers who commuted into the municipality and 451 workers who commuted away. The municipality is a net exporter of workers, with about 28.2 workers leaving the municipality for every one entering. Of the working population, 19.7% used public transportation to get to work, and 66.9% used a private car.
Religion
From the 2000 census, 426 or 45.0% were Roman Catholic, while 190 or 20.1% belonged to the Swiss Reformed Church. Of the rest of the population, there were 7 members of an Orthodox church (or about 0.74% of the population), there were 10 individuals (or about 1.06% of the population) who belonged to the Christian Catholic Church, and there were 33 individuals (or about 3.49% of the population) who belonged to another Christian church. There was 1 individual who was Jewish, and 8 (or about 0.85% of the population) who were Islamic. There was 1 person who was Buddhist. 235 (or about 24.84% of the population) belonged to no church, are agnostic or atheist, and 35 individuals (or about 3.70% of the population) did not answer the question.
Education
In Himmelried about 378 or (40.0%) of the population have completed non-mandatory upper secondary education, and 147 or (15.5%) have completed additional higher education (either university or a Fachhochschule). Of the 147 who completed tertiary schooling, 55.8% were Swiss men, 31.3% were Swiss women, 7.5% were non-Swiss men and 5.4% were non-Swiss women.
During the 2010-2011 school year there were a total of 67 students in the Himmelried school system. The education system in the Canton of Solothurn allows young children to attend two years of non-obligatory Kindergarten. During that school year, there were 11 children in kindergarten. The canton's school system requires students to attend six years of primary school, with some of the children attending smaller, specialized classes. In the municipality there were 56 students in primary school. The secondary school program consists of three lower, obligatory years of schooling, followed by three to five years of optional, advanced schools. All the lower secondary students from Himmelried attend their school in a neighboring municipality.
As of 2000, there was one student in Himmelried who came from another municipality, while 88 residents attended schools outside the municipality.