
 | ||
The Global Hunger Index (GHI) is a multidimensional statistical tool used to describe the state of countries’ hunger situation. The GHI measures progress and failures in the global fight against hunger. The GHI is updated once a year.
Contents
- Calculation of the Index
- Global and regional trends
- Ranking
- Focus 2016 Getting to zero hunger
- Focus 2015 Armed Conflict and Chronic Hunger
- Focus of the GHI 2014 Hidden Hunger
- Focus of the GHI 2013 Resilience to build food and nutrition security
- Focus of the GHI 2011 Rising and volatile food prices
- Focus of the GHI 2010 Early Childhood Under nutrition
- Other activities
- References
The Index was adopted and further developed by the International Food Policy Research Institute (IFPRI), and was first published in 2006 with the Welthungerhilfe, a German non-profit organization (NPO). Since 2007, the Irish NGO Concern Worldwide joined the group as co-publisher.
The 2016 Global Hunger Index (GHI) report—the eleventh in an annual series—presents a multidimensional measure of national, regional, and global hunger. It shows that the world has made progress in reducing hunger since 2000, but still has a long way to go, with levels of hunger still serious or alarming in 50 countries. This year's report hails a new paradigm of international development proposed in the United Nations’ 2030 Agenda for Sustainable Development, which envisages Zero Hunger by 2030, as one goal among 17, in a holistic, integrated, and transformative plan for the world.
In addition to the ranking, the Global Hunger Index report every year focuses on a main topic: in 2016 the thematic focus is on getting to zero hunger.
Topics of previous years included:
In addition to the yearly GHI, the Hunger Index for the States of India (ISHI) was published in 2008 and the Sub-National Hunger Index for Ethiopia was published in 2009.
India tops world hunger list with 194 million people. That's more than the combined population of Australia, Canada, United Kingdom and France.
An interactive map allows users to visualize the data for different years and zoom into specific regions or countries.
Calculation of the Index
The Index ranks countries on a 100-point scale, with 0 being the best score (no hunger) and 100 being the worst, although neither of these extremes is reached in practice. Values less than 10.0 reflect low hunger, values from 10.0 to 19.9 reflect moderate hunger, values from 20.0 to 34.9 indicate serious hunger, values from 35.0 to 49.9 reflect alarming hunger, and values of 50.0 or more reflect extremely alarming hunger levels.
The GHI combines 4 component indicators: 1) the proportion of the undernourished as a percentage of the population; 2) the proportion of children under the age of five suffering from wasting; 3) the proportion of children under the age of five suffering from stunting; 4) the mortality rate of children under the age of five.
The data and projections used for the 2016 GHI are for the period from 2011 and 2016—the most recent available data for the four components of the GHI. The data on the proportion of undernourished come from the Food and Agriculture Organization of the UN (FAO) and include authors' estimates. Data on child wasting and stunting are collected from UNICEF, the World Health Organization, the World Bank, WHO, MEASURE DHS, the Indian Ministry of Women and Child Development, and also include the authors’ own estimates. Data on child mortality are from the UN Inter-agency Group for Child Mortality Estimation.
Global and regional trends
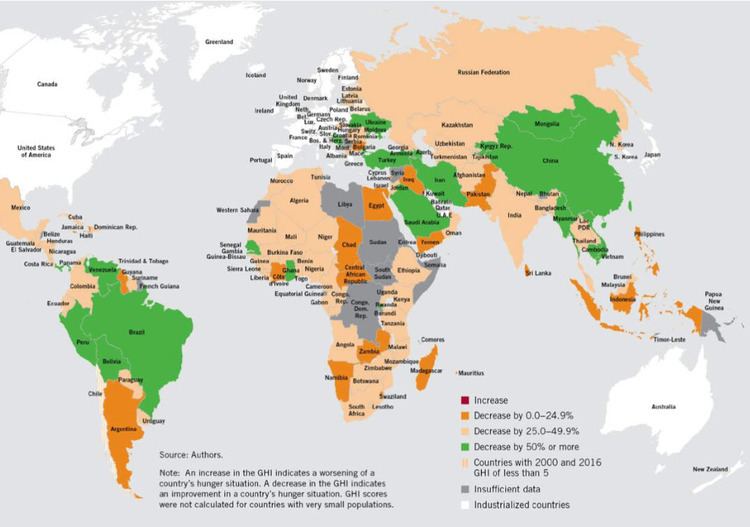
According to the 2016 GHI, levels of hunger are still serious or alarming in 50 countries. The highest hunger levels are still found in Africa south of the Sahara and South Asia. Although GHI scores for these two regions have declined over time, the current levels remain close to the alarming category. Africa south of the Sahara has achieved the largest absolute improvement since 2000 and South Asia has also seen a sizeable reduction—but the decline in hunger must accelerate in these regions if the world is to achieve Zero Hunger by 2030.
The 2016 Global Hunger Index for the developing world is 21.3. Although this hunger level is still considered serious, it is 29 percent lower than the 2000 GHI, representing a considerable improvement.
The food and hunger situation in Central African Republic, and Chad, both countries with recent histories of civil war, remains alarming, according to the 2016 GHI. Since 2000, Rwanda, Cambodia, and Myanmar have seen the biggest absolute reductions in hunger, with GHI scores down by over 50% in each country.
Ranking
The Global Hunger Index is composed of the proportion of the undernourished as a percentage of the population, the prevalence of underweight children under the age of five and the mortality rate of children under the age of five (calculated average, in percentages).
The 2016 GHI score could not be calculated for Bahrain, Bhutan, Burundi, the Comoros, the Democratic Republic of the Congo, Eritrea, Libya, Papua New Guinea, Qatar, Somalia, South Sudan, Sudan, and the Syrian Arab Republic, because of a lack of data.
Focus 2016: Getting to zero hunger
The 2016 Global Hunger Index (GHI) presents a multidimensional measure of national, regional, and global hunger, focusing on how the world can get to Zero Hunger by 2030.
The developing world has made substantial progress in reducing hunger since 2000. The 2016 GHI shows that the level of hunger in developing countries as a group has fallen by 29 percent. Yet this progress has been uneven, and great disparities in hunger continue to exist at the regional, national, and subnational levels.
The 2016 GHI emphasizes that the regions, countries, and populations most vulnerable to hunger and undernutrition have to be identified, so improvement can be targeted there, if the world community wants to seriously Sustainable Development Goal 2 on ending hunger and achieving food security.
Focus 2015: Armed Conflict and Chronic Hunger
The chapter on hunger and conflict shows that the time of the great famines with more than 1 million people dead is over. There is, however, a clear connection between armed conflict and severe hunger. Most of the countries scoring worst in the 2015 GHI, are experiencing armed conflict or have in recent years. Still, severe hunger exists also without conflict present as the cases of several countries in South Asia and Africa show.
Since 2005 and increase in armed conflict can be seen. Unless armed conflicts can be reduced there is little hope for overcoming hunger.
Focus of the GHI 2014: Hidden Hunger
Hidden hunger concerns over 200 million people worldwide. This micronutrient deficiency develops when humans do not take in enough micronutrients such as zinc, folate, iron and vitamins, or when their bodies cannot absorb them. Reasons include an unbalanced diet, a higher need for micronutrients (e.g. during pregnancy or while breast feeding) but also health issues related to sickness, infections or parasites.
The consequences for individuals can be devastating: these often include mental impairment, bad health, low productivity and death caused by sickness. In particular, children are affected if they do not absorb enough micronutrients in the first 1000 days of their lives (beginning with conception).
Micronutrient deficiencies are responsible for an estimated 1.1 million of the yearly 3.1 million death caused by undernutrition in children. Despite the magnitude of the problem, it is still not easy to get precise data on the spread of hidden hunger. Macronutrient and micronutrient deficiencies cause a loss in global productivity of 1.4 to 2.1 billion US Dollars per year.
Different measures exist to prevent hidden hunger. It is essential to ensure that humans maintain a diverse diet. The quality of produce is as important as the caloric input. This can be achieved by promoting the production of a wide variety of nutrient-rich plants and the creation of house gardens.
Other possible solutions are the industrial enrichment of food or biofortification of feedplants (e.g. vitamin A rich sweet potatoes). In the case of acute nutrient deficiency and in specific life phases, food supplements can be used. In particular, the addition of vitamin A leads to a better child survival rate.
Generally, the situation concerning hidden hunger can only be improved when many measures intermesh. In addition to the direct measures described above, this includes the education and empowerment of women, the creation of better sanitation and adequate hygiene, and access to clean drinking water and health services.
Focus of the GHI 2013: Resilience to build food and nutrition security
Many of the countries, in which the hunger situation is "alarming" or "extremely alarming", are particularly prone to crises: In the African Sahel people experience yearly droughts. On top of that, they have to deal with violent conflict and natural calamities. At the same time, the global context becomes more and more volatile (financial and economic crises, food price crises).
The inability to cope with these crises leads to the destruction of many development successes that had been achieved over the years. In addition, people have even less resources to withstand the next shock or crises. 2.6 billion people in the world live with less than 2 USD per day. For them, a sickness in the family, crop failure after a drought or the interruption of remittances from relatives who live abroad can set in motion a downward spiral from which they cannot free themselves on their own.
It is therefore not enough to support people in emergencies and, once the crises is over, to start longer term development efforts. Instead, emergency and development assistance has to be conceptualized with the goal of increasing resilience of poor people against these shocks.
The Global Hunger Index differentiates three coping strategies. The lower the intensity of the crises, the less resources have to be used to cope with the consequences:
Based on this analysis the authors present several policy recommendations:
Focus of the GHI 2011: Rising and volatile food prices
The report cites 3 factors as the main reasons for high volatility, or price changes, and price spikes of food:
Volatility and prices increases are worsened according to the report by the concentration of staple foods in a few countries and export restrictions of these goods, the historical low of worldwide cereal reserves and the lack of timely information on food products, reserves and price developments. Especially this lack of information can lead to overreactions in the markets. Moreover, seasonal limitations on production possibilities, limited land for agricultural production, limited access to fertilizers and water, as well as the increasing demand resulting from population growth, puts pressure on food prices.
According to the Global Hunger Index 2011 price trends show especially harsh consequences for poor and under-nourished people, because they are not capable to react to price spikes and price changes. Reactions, following these developments, can include: reduced calorie intake, no longer sending children to school, riskier income generation such as prostitution, criminality, or searching landfills, and sending away household members, who cannot be fed anymore. In addition, the report sees an all-time high in the instability and unpredictability of food prices, which after decades of slight decrease, increasingly show price spikes (strong and short-term increase).
At a national level, especially food importing countries (those with a negative food trade balance, are affected by the changing prices.
Focus of the GHI 2010: Early Childhood Under-nutrition
Under-nutrition among children has reached terrible levels. About 195 million children under the age of five in the developing world – about one in three children - are too small and thus underdeveloped. Nearly one in four children under age five – 129 million – is underweight, and one in 10 is severely underweight. The problem of child under-nutrition is concentrated in a few countries and regions with more than 90 percent of stunted children living in Africa and Asia. 42% of the world's undernourished children live in India alone.
The evidence presented in the report shows that the window of opportunity for improving nutrition spans is the 1,000 days between conception and a child's second birthday (that is the period from -9 to +24 months). Children who are do not receive adequate nutrition during this period have increased risks to experiencing lifelong damage, including poor physical and cognitive development, poor health, and even early death. The consequences of malnutrition that occurred after 24 months of a child's life are by contrast largely reversible.
Other activities
IFPRI is a partner in Compact2025, a partnership that develops and disseminates evidence-based advice to politicians and other decision-makers aimed at ending hunger and undernutrition in the coming 10 years. The Compact2025 uses GHI data.