
 | ||
In equilibrium conditions (without mutational or selective pressure and with nucleotides randomly distributed within the genome) there is an equal frequency of the four DNA bases (Adenine, Guanine, Thymine, and Cytosine) on both single strands of a DNA molecule. However, in most prokaryotes (e.g. E. coli) and some archaea (e.g. Sulfolobus solfataricus), nucleotide compositions are asymmetric between the leading strand and the lagging strand: the leading strand contains more Guanine (G) and Thymine (T), whereas the lagging strand contains more Adenine (A) and Cytosine (C). This phenomenon is referred to as GC and AT skew. It is represented mathematically as follows:
Contents
- Asymmetric nucleotide composition
- Calculation and GC skew plots
- GC Asymmetry
- CGC Skew
- Z curve
- Mechanism of GC and AT skew
- Firmicutes
- The application of GC skew
- References
GC skew = (G - C)/(G + C)
AT skew = (A - T)/(A + T)
Asymmetric nucleotide composition
Erwin Chargaff's work in 1950 demonstrated that, in DNA, the bases guanine and cytosine were found in equal abundance, and the bases adenine and thymine were found in equal abundance. However, there was no equality between the amount of one pair versus the other. Chargaff’s finding is referred to as Chargaff's rule or parity rule 1. Three years later Watson and Crick used this fact during their derivation the structure of DNA, their double helix model.
A natural result of parity rule 1, at the state of equilibrium, in which there is no mutation and/or selection biases in any of the two DNA strands, is that when there is an equal substitution rate, the complementary nucleotides on each strand have equal amounts of a given base and its complement. In other words, in each DNA strand the frequency of occurrence of T is equal to A and the frequency of occurrence of G is equal to C because the substitution rate is presumably equal. This phenomenon is referred to as parity rule 2. Hence, the second parity rule only exists, when there is no mutation or substitution.
Any deviation from parity rule 2 will result in asymmetric base composition that discriminates the leading from the lagging strand. This asymmetry is referred to as GC or AT skew.
There is a richness of guanine over cytosine and thymine over adenine in the leading strand and vice versa for the lagging strand. The nucleotide composition skew spectra ranges from -1, which corresponds to G = 0 or A = 0, to +1, which corresponds to T= 0 or C = 0. Therefore, positive GC skew represents richness of G over C and the negative GC skew represents richness of C over G. As a result one expects to see a positive GC skew and negative AT skew in the leading strand, and a negative GC skew and a positive AT skew in the lagging strand. GC or AT skew changes sign at the boundaries of the two replichores, which correspond to DNA replication origin or terminus. Originally, this asymmetric nucleotide composition was explained as a different mechanism used in DNA replication between the leading strand and lagging strand. DNA replication is semi-conservative and an asymmetric process itself. This asymmetry is due the formation of the replication fork and its division into nascent leading and lagging strands. The leading strand is synthesized continuously and in juxtapose to the leading strand; the lagging strand is replicated through short fragments of polynucleotide (Okazaki fragments) in a 5' to 3' direction.
Calculation and GC skew plots
There are three major approaches to calculate and graphically demonstrate GC skew and its properties.
GC Asymmetry
The first approach is GC and AT Asymmetry. Jean R. Lobry was the first to illustrate the nucleotide composition asymmetry throughout the genome of three bacterium: E. coli, Bacillus subtilis, and haemophilus influenzae by using GC and AT bias. This is the most common and traditional way to quantitatively evaluate base composition asymmetry. The original formulas at the time were not named skew, but rather deviation from C or A:
deviation from C = (C - G)/(C + G)
deviation from A = (A - T)/(A + T)
A, T, G, and C represent the frequency of occurrence of the equivalent base in a particular sequence in a defined length. A window sliding strategy is used to calculate deviation from C through the genome. In these plots, a positive deviation from C corresponds to lagging strand and negative deviation from C corresponds to leading strand. Furthermore, the site where the deviation sign switches corresponds to origin or terminal. The x-axis represents the chromosome locations plotted 5' to 3' and y-axis represents the deviation value. The major weakness of this method is its window-size dependent property. Therefore, choosing an adequate window size greatly affects the outcome of the plot. Other techniques should be combined with deviation in order to identify and locate the origin of the DNA replication with greater accuracy.
CGC Skew
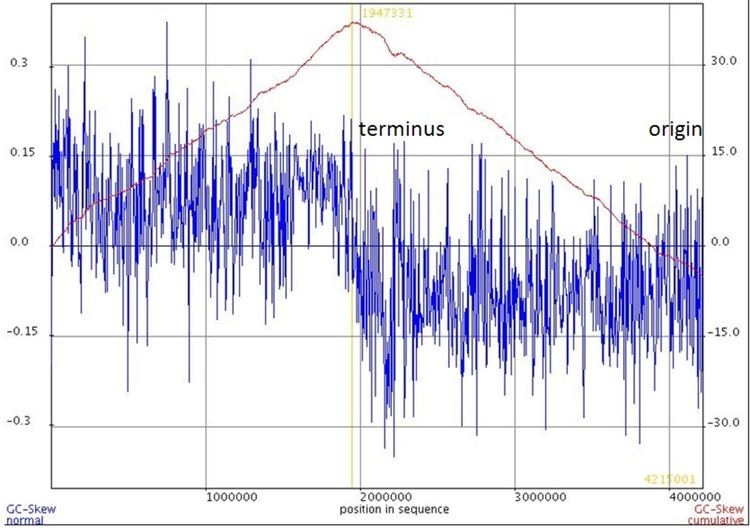
The second approach is referred to as cumulative GC skew (CGC skew). This method still uses the sliding window strategy but it takes advantage of the sum of the adjacent windows from an arbitrary start. In this scheme, the entire genome is usually plotted 5' to 3' using an arbitrary start and arbitrary strand. In the cumulative GC skew plot, the peaks corresponds to the switch points (terminus or origin).
In contrast to Lobry's earlier paper, recent implementations of GC skew flips the original definition, redefining it to be:
GC skew = (G - C)/(G + C).
With the flipped definition of GC skew, the maximum value of the cumulative skew corresponds to the terminal, and the minimum value corresponds to the origin of replication.
Z-curve
The final approach is the Z curve. Unlike the previous methods, this method do not uses the sliding window strategy and is thought to perform better as to finding the origin of replication. In this method each base’s cumulative frequency with respect to the base at the beginning of the sequence is investigated. Z curve uses a three-dimensional representation with the following parameters:
Xn = (An + Gn) – (Cn + Tn)
Yn = (An + Cn) – (Gn + Tn)
Zn = (An + Tn) – (Cn + Gn)
Where n = 0, 1, 2, …, N, Xn represents the excess of purine over pyrimidine, Yn denotes excess of keto over amino, and Zn shows the relationship between the weak and strong hydrogen bonds. X and Y components can alone detect the replication origin and asymmetric composition of the strands. A combination of these methods should be used for prediction of replication origin and terminal, in order to compensate for their weakness.
Mechanism of GC and AT skew
There is lack of consensus in scientific community with regard to the mechanism underlining the bias in nucleotide composition within each DNA strand. There are two major schools of thought that explain the mechanism behind the strand specific nucleotide composition in bacteria.
The first one describes a bias and an asymmetric mutational pressure on each DNA strand during replication and transcription. Due to the asymmetric nature of the replication process, an unequal mutational frequency and DNA repair efficiency during the replication process can introduce more mutations in one strand as compared to the other. Furthermore, the time used for replication between the two strands varies and may lead to asymmetric mutational pressure between leading and lagging strand. In addition to mutations during DNA replication, transcriptional mutations can create strand specific nucleotide composition skew. Deamination of cytosine and ultimately mutation of cytosine to thymine in one DNA strand can increase the relative number of guanine and thymine to cytosine and adenine. In most bacteria majority of the genes are encoded in the leading strand. For instance, the leading strand in Bacillus subtilis encodes 75% of the genes. In addition an excess of deamination and conversion of cytosine to thymine in the coding strand compared to the non-coding strand has been reported. One possible explanation is that the non-transcribed strand (coding strand) is single stranded during the transcription process; therefore, it is more vulnerable to deamination compared to the transcribed strand (non-coding strand). Another explanation is that the deamination repair activity during transcription does not occur on the coding strand. Only the transcribed strand benefits from these deamination repair events.
The second school of thought describes the mechanism of GC and AT skew as resulting from differential selective pressure between the leading and lagging strands. Examination of the prokaryotic genome shows a preference in third codon position for G over C and T over A. This discrimination creates an asymmetric nucleotide composition, if the coding strand is unequally distributed between the leading and lagging strands, as in the case for bacteria. In addition, the highly transcribed genes, such as ribosomal proteins, have been shown to be located mostly on the leading strand in bacteria. Therefore, a bias in the third-position codon choice of G over C can lead to GC skew. Additionally, some signal sequences are rich in guanine and thymine, such as chi sequences, and these sequences might have a higher frequency of occurrence in one strand compared to the other.
Both mutational and selective pressure can independently introduce asymmetry in DNA strands. However the combination and cumulative effect of both mechanisms is the most plausible explanation for GC and AT skew.
Firmicutes
In the majority of prokaryotes there is a richness of G over C and T over A in the leading strand and vice versa for the lagging strand. However, it has been reported that there is positive AT skew in the leading strand in some prokaryotes, such as the phylum Firmicutes. Firmicutes demonstrate an atypical AT skew. This unique nucleotide composition is thought to be due to selection pressure of adenine over thymine in the coding region. This biased selection avoids the formation of stop codons and use of metabolically expensive amino acids. The coding regions are mostly distributed on the leading strand; therefore, A over T richness is observed in Firmicutes.
The application of GC skew
The GC skew is proven to be useful as the indicator of the DNA leading strand, lagging strand, replication origin, and replication terminal. Most prokaryotes and archaea contain only one DNA replication origin. The GC skew is positive and negative in the leading strand and in the lagging strand respectively; therefore, it is expected to see a switch in GC skew sign just at the point of DNA replication origin and terminus. GC skew can also be used to study the strand biases and mechanism related to them by calculating the excess of one base over its complementary base in different milieus. Method such as GC skew, CGC skew, and Z-curve are tools that can provide opportunity to better investigate the mechanism of DNA replication in different organisms.