
 | ||
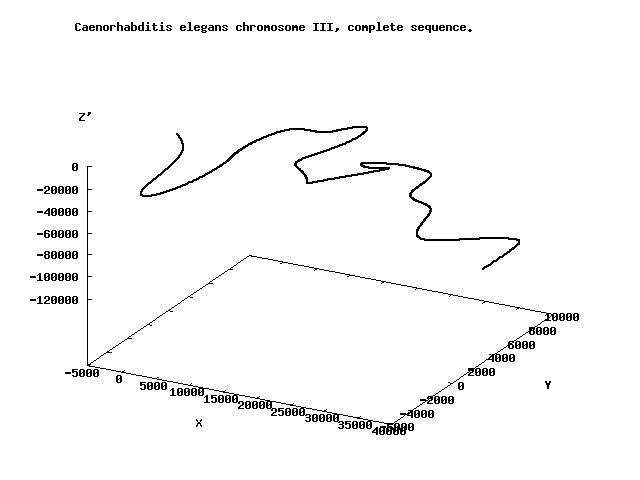
The Z curve (or Z-curve) method is a bioinformatics algorithm for genome analysis. The Z-curve is a three-dimensional curve that constitutes a unique representation of a DNA sequence, i.e., for the Z-curve and the given DNA sequence each can be uniquely reconstructed from the other. The resulting curve has a zigzag shape, hence the name Z-curve.
Contents
Background
The Z Curve method was first created in 1994 as a way to visually map a DNA or RNA sequence. Different properties of the Z curve, such as its symmetry and periodicity can give unique information on the DNA sequence. The Z curve is generated from a series of nodes, P0, P1,…PN, with the coordinates xn, yn, and zn (n=0,1,2…N, with N being the length of the DNA sequence). The Z curve is created by connecting each of the nodes sequentially.
Applications
Information on the distribution of nucleotides in a DNA sequence can be determined from the Z curve. The four nucleotides are combined into six different categories. The nucleotides are placed into each category by some defining characteristic and each category is designated a letter.
The x, y, and z components of the Z curve display the distribution of each of these categories of bases for the DNA sequence being studied. The x-component represents the distribution of purines and pyrimidine bases (R/Y). The y-component shows the distribution of amino and keto bases (M/K) and the z-component shows the distribution of strong-H bond and weak-H bond bases (S/W) in the DNA sequence.
The Z-curve method has been used in many different areas of genome research, such as replication origin identification,, ab initio gene prediction, isochore identification, genomic island identification and comparative genomics. Analysis of the Z curve has also been shown to be able to predict if a gene contains introns,
Research
Experiments have shown that the Z curve can be used to identify the replication origin in various organisms. One study analyzed the Z curve for multiple species of Archaea and found that the oriC is located at a sharp peak on the curve followed by a broad base. This region was rich in AT bases and had multiple repeats, which is expected for replication origin sites. This and other similar studies were used to generate a program that could predict the origins of replication using the Z curve.
The Z curve has also been experimentally used to determine phylogenetic relationships. In one study, a novel coronavirus in China was analyzed using sequence analysis and the Z curve method to determine its phylogenetic relationship to other coronaviruses. It was determined that similarities and differences in related species can quickly by determined by visually examining their Z curves. An algorithm was created to identify the geometric center and other trends in the Z curve of 24 species of coronaviruses. The data was used to create a phylogenetic tree. The results matched the tree that was generated using sequence analysis. The Z curve method proved superior because while sequence analysis creates a phylogenetic tree based solely on coding sequences in the genome, the Z curve method analyzed the entire genome.
Criticism and Limitations
The Z curve method has been criticized for over analyzing the genomic sequence and including parameters that are not significant. One study analyzed 235 genomes of bacteria and determined that the z coordinate of the Z curve accounted for 99.9% of the genetic variance and the x and y coordinates were not meaningful in studying nucleotide composition. The original authors of the Z curve method have since published a rebuttal indicating that the criticisms confuse numeral smallness with biological insignificance, because variations of purine/pyrimidine and amino/keto bases (x and y components), although less than that of GC content, contain rich information that is important and useful, such as in locating replication origins of bacterial and archaeal genomes.
Similar methods of visually representing genomic sequences have since been created that are better equipped to identify a broad range of genomic structures. The DNA Hilbert–Peano curve is a 2D color image of a genomic sequence that can highlight all structures of interest in a sequence at once.