
 | ||
In biotechnology, flow cytometry is a laser- or impedance-based, biophysical technology employed in cell counting, cell sorting, biomarker detection and protein engineering, by suspending cells in a stream of fluid and passing them by an electronic detection apparatus. It allows simultaneous multiparametric analysis of the physical and chemical characteristics of up to thousands of particles per second.
Contents
- History
- Name of the technology
- Flow cytometers
- Gating
- Computational analysis
- Fluorescence activated cell sorting FACS
- Fluorescent labels
- Quantum dots
- Isotope labeling
- Cytometric bead array
- Impedance flow cytometry
- Measurable parameters
- Applications
- References
Flow cytometry is routinely used in the diagnosis of health disorders, especially blood cancers, but has many other applications in basic research, clinical practice and clinical trials. A common variation is to physically sort particles based on their properties, so as to purify populations of interest.
History
The first impedance-based flow cytometry device, using the Coulter principle, was disclosed in U.S. Patent 2,656,508, issued in 1953, to Wallace H. Coulter. Mack Fulwyler was the inventor of the forerunner to today's flow cytometers - particularly the cell sorter. Fulwyler developed this in 1965 with his publication in Science. The first fluorescence-based flow cytometry device (ICP 11) was developed in 1968 by Wolfgang Göhde from the University of Münster, filed for patent on 18 December 1968 and first commercialized in 1968/69 by German developer and manufacturer Partec through Phywe AG in Göttingen. At that time, absorption methods were still widely favored by other scientists over fluorescence methods. Soon after, flow cytometry instruments were developed, including the Cytofluorograph (1971) from Bio/Physics Systems Inc. (later: Ortho Diagnostics), the PAS 8000 (1973) from Partec, the first FACS (Fluorescence-activated cell sorting) instrument from Becton Dickinson (1974), the ICP 22 (1975) from Partec/Phywe and the Epics from Coulter (1977/78). The first label-free high-frequency impedance flow cytometer based on a patented microfluidic "lab-on-chip", Ampha Z30, was introduced by Amphasys (2012).
Name of the technology
The original name of the fluorescence-based flow cytometry technology was "pulse cytophotometry" (German: Impulszytophotometrie), based on the first patent application on fluorescence-based flow cytometry. At the 5th American Engineering Foundation Conference on Automated Cytology in Pensacola (Florida) in 1976 - eight years after the introduction of the first fluorescence-based flow cytometer (1968) - it was agreed to commonly use the name "flow cytometry", a term that quickly became popular.
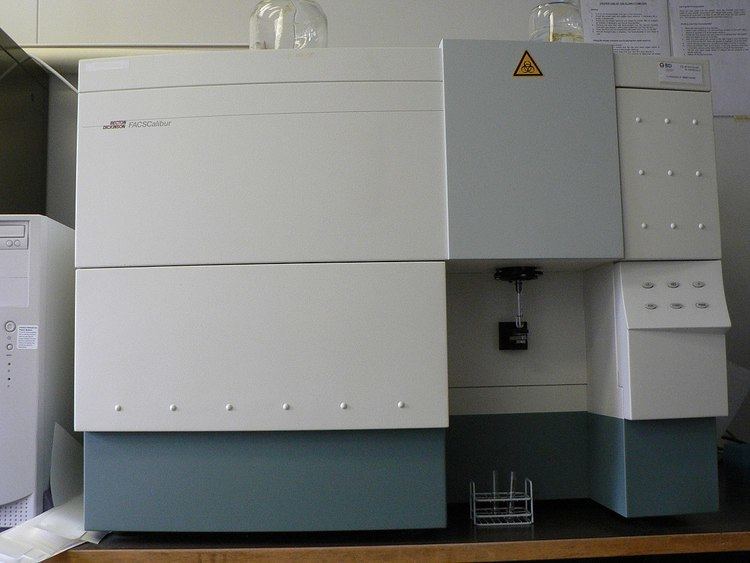
Flow cytometers
Modern flow cytometers are able to analyze several thousand particles every second, in "real time," and can actively separate and isolate particles having specified properties. A flow cytometer is similar to a microscope, except that, instead of producing an image of the cell, flow cytometry offers "high-throughput" (for a large number of cells) automated quantification of set parameters. To analyze solid tissues, a single-cell suspension must first be prepared.
A flow cytometer has five main components:
The process of collecting data from samples using the flow cytometer is termed 'acquisition'. Acquisition is mediated by a computer physically connected to the flow cytometer, and the software which handles the digital interface with the cytometer. The software is capable of adjusting parameters (e.g., voltage, compensation) for the sample being tested, and also assists in displaying initial sample information while acquiring sample data to ensure that parameters are set correctly. Early flow cytometers were, in general, experimental devices, but technological advances have enabled widespread applications for use in a variety of both clinical and research purposes. Due to these developments, a considerable market for instrumentation, analysis software, as well as the reagents used in acquisition such as fluorescently labeled antibodies has developed.
Modern instruments usually have multiple lasers and fluorescence detectors. The current record for a commercial instrument is ten lasers and 30 fluorescence detectors. Increasing the number of lasers and detectors allows for multiple antibody labeling, and can more precisely identify a target population by their phenotypic markers. Certain instruments can even take digital images of individual cells, allowing for the analysis of fluorescent signal location within or on the surface of cells.
Gating
The data generated by flow-cytometers can be plotted in a single dimension, to produce a histogram, or in two-dimensional dot plots or even in three dimensions. The regions on these plots can be sequentially separated, based on fluorescence intensity, by creating a series of subset extractions, termed "gates." Specific gating protocols exist for diagnostic and clinical purposes especially in relation to hematology.
The plots are often made on logarithmic scales. Because different fluorescent dyes' emission spectra overlap, signals at the detectors have to be compensated electronically as well as computationally. Data accumulated using the flow cytometer can be analyzed using software, e.g., JMP (statistical software), WinMDI, Flowing Software, and web-based Cytobank (all freeware), Cellcion, FCS Express, FlowJo, FACSDiva, CytoPaint (aka Paint-A-Gate), VenturiOne, CellQuest Pro, Infinicyt or Cytospec. Once the data is collected, there is no need to stay connected to the flow cytometer and analysis is most often performed on a separate computer. This is especially necessary in core facilities where usage of these machines is in high demand.
Computational analysis
Recent progress on automated population identification using computational methods has offered an alternative to traditional gating strategies. Automated identification systems could potentially help findings of rare and hidden populations. Representative automated methods include FLOCK in Immunology Database and Analysis Portal (ImmPort), SamSPECTRAL and flowClust in Bioconductor, and FLAME in GenePattern. T-Distributed Stochastic Neighbor Embedding (tSNE) is an algorithm designed to perform dimensionality reduction, to allow visualization of complex multi-dimensional data in a two-dimensional "map". Collaborative efforts have resulted in an open project called FlowCAP (Flow Cytometry: Critical Assessment of Population Identification Methods,) to provide an objective way to compare and evaluate the flow cytometry data clustering methods, and also to establish guidance about appropriate use and application of these methods.
Fluorescence-activated cell sorting (FACS)
Fluorescence-activated cell sorting (FACS) is a specialized type of flow cytometry. It provides a method for sorting a heterogeneous mixture of biological cells into two or more containers, one cell at a time, based upon the specific light scattering and fluorescent characteristics of each cell. It is a useful scientific instrument as it provides fast, objective and quantitative recording of fluorescent signals from individual cells as well as physical separation of cells of particular interest. The technique was expanded by Len Herzenberg, who was responsible for coining the term FACS. Herzenberg won the Kyoto Prize in 2006 for his seminal work in flow cytometry.
The cell suspension is entrained in the center of a narrow, rapidly flowing stream of liquid. The flow is arranged so that there is a large separation between cells relative to their diameter. A vibrating mechanism causes the stream of cells to break into individual droplets. The system is adjusted so that there is a low probability of more than one cell per droplet. Just before the stream breaks into droplets, the flow passes through a fluorescence measuring station where the fluorescent character of each cell of interest is measured. An electrical charging ring is placed just at the point where the stream breaks into droplets. A charge is placed on the ring based immediately prior to fluorescence intensity being measured, and the opposite charge is trapped on the droplet as it breaks from the stream. The charged droplets then fall through an electrostatic deflection system that diverts droplets into containers based upon their charge. In some systems, the charge is applied directly to the stream, and the droplet breaking off retains charge of the same sign as the stream. The stream is then returned to neutral after the droplet breaks off.
The acronym FACS is trademarked and owned by Becton, Dickinson and Company. Among the large majority of researchers who use this technology for sorting or analysis, this term has become genericized, much like Xerox for photocopy or Kleenex for facial tissue.
Fluorescent labels
A wide range of fluorophores can be used as labels in flow cytometry. Fluorophores, or simply "fluors", are typically attached to an antibody that recognizes a target feature on or in the cell; they may also be attached to a chemical entity with affinity for the cell membrane or another cellular structure. Each fluorophore has a characteristic peak excitation and emission wavelength, and the emission spectra often overlap. Consequently, the combination of labels which can be used depends on the wavelength of the lamp(s) or laser(s) used to excite the fluorochromes and on the detectors available. The maximum number of distinguishable fluorescent labels is thought to be 17 or 18, and this level of complexity necessitates laborious optimization to limit artifacts, as well as complex deconvolution algorithms to separate overlapping spectra. Flow cytometry uses fluorescence as a quantitative tool; the utmost sensitivity of flow cytometry is unmatched by other fluorescent detection platforms such as confocal microscopy. Absolute fluorescence sensitivity is generally lower in confocal microscopy because out-of-focus signals are rejected by the confocal optical system and because the image is built up serially from individual measurements at every location across the cell, reducing the amount of time available to collect signal.
Quantum dots
Quantum dots are sometimes used in place of traditional fluorophores because of their narrower emission peaks.
Isotope labeling
Mass cytometry overcomes the fluorescent labeling limit by utilizing lanthanide isotopes attached to antibodies. This method could theoretically allow the use of 40 to 60 distinguishable labels and has been demonstrated for 30 labels. Mass cytometry is fundamentally different from flow cytometry: cells are introduced into a plasma, ionized, and associated isotopes are quantified via time-of-flight mass spectrometry. Although this method permits the use of a large number of labels, it currently has lower throughput capacity than flow cytometry. It also destroys the analysed cells, precluding their recovery by sorting.
Cytometric bead array
In addition to the ability to label and identify individual cells via fluorescent antibodies, cellular products such as cytokines, proteins, and other factors may also be measured as well. Similar to ELISA sandwich assays, cytometric bead array (CBA) assays use multiple bead populations typically differentiated by size and different levels of fluorescence intensity to distinguish multiple analytes in a single assay. The amount of the analyte captured is detected via a biotinylated antibody against a secondary epitope of the protein, followed by a streptavidin-R-phycoerythrin treatment. The fluorescent intensity of R-phycoerythrin on the beads is quantified on a flow cytometer equipped with a 488 nm excitation source. Concentrations of a protein of interest in the samples can be obtained by comparing the fluorescent signals to those of a standard curve generated from a serial dilution of a known concentration of the analyte. Commonly also referred to as cytokine bead array (CBA).
Impedance flow cytometry
Impedance-based single cell analysis systems are commonly known as Coulter counters. They represent a well-established method for counting and sizing virtually any kind of cells and particles. The label-free technology has recently been enhanced by a "lab-on-a-chip" based approach and by applying high frequency alternating current (AC) in the radio frequency range (from 100 kHz to 30 MHz) instead of a static direct current (DC) or low frequency AC field. This patented technology allows a highly accurate cell analysis and provides additional information like membrane capacitance and viability. The relatively small size and robustness allow battery powered on-site use in the field.
Measurable parameters
This list is very long and constantly expanding.
Applications
The technology has applications in a number of fields, including molecular biology, pathology, immunology, plant biology and marine biology. It has broad application in medicine (especially in transplantation, hematology, tumor immunology and chemotherapy, prenatal diagnosis, genetics and sperm sorting for sex preselection). Also, it is extensively used in research for the detection of DNA damage, caspase cleavage and apoptosis. In marine biology, the autofluorescent properties of photosynthetic plankton can be exploited by flow cytometry in order to characterise abundance and community structure. In protein engineering, flow cytometry is used in conjunction with yeast display and bacterial display to identify cell surface-displayed protein variants with desired properties.