
Available in English Website fivethirtyeight.com | ||
 | ||
Type of site Opinion poll analysis, politics, economics, sports blog | ||
FiveThirtyEight, sometimes referred to as 538, is a website that focuses on opinion poll analysis, politics, economics, and sports blogging. The website, which takes its name from the number of electors in the United States electoral college, was founded on March 7, 2008, as a polling aggregation website with a blog created by analyst Nate Silver. In August 2010, the blog became a licensed feature of The New York Times online. It was renamed FiveThirtyEight: Nate Silver's Political Calculus. In July 2013, ESPN announced that it would become the owner of the FiveThirtyEight brand and site, and Silver was appointed as editor-in-chief. The ESPN-owned FiveThirtyEight began publication on March 17, 2014. In the ESPN era, the FiveThirtyEight blog has covered a broad spectrum of subjects including politics, sports, science, economics, and popular culture.
Contents
- Genesis and history
- Weighting of polls
- Smoothing the poll results
- Senate races
- Swing state analysis
- Final projections of 2008 elections
- Focus
- Controversy over transparency in pollster ratings
- Partnership with The New York Times 20102013
- Writers
- Sports
- Economics and hurricanes
- Occupy Wall Street protests
- 2010 US mid term elections
- US Senate
- US House of Representatives
- State governorships
- 2012 US elections
- Presidential primary elections
- Presidential general election
- Criticism of presidential forecasts
- US Senate elections
- Under ESPN ownership
- 2014 US elections
- 2016 Oscars predictions
- Recognition and awards
- References
During the U.S. presidential primaries and United States general election of 2008 the site compiled polling data through a unique methodology derived from Silver's experience in baseball sabermetrics to "balance out the polls with comparative demographic data." Silver weighted "each poll based on the pollster's historical track record, sample size, and recentness of the poll".
Since the 2008 election, the site has published articles – typically creating or analyzing statistical information – on a wide variety of topics in current politics and political news. These included a monthly update on the prospects for turnover in the U.S. Senate; federal economic policies; Congressional support for legislation; public support for health care reform, global warming legislation, LGBT rights; elections around the world; marijuana legalization; and numerous other topics. The site and its founder are best known for election forecasts, including the 2012 presidential election in which FiveThirtyEight correctly predicted the vote winner of all 50 states.
During its first five and a half years FiveThirtyEight won numerous awards - both when it was an independent blog and when it was published by The New York Times. These included "Bloggie" Awards for "Best Political Coverage" in 2008 and "Best Weblog about Politics" in 2009, as well as "Webbies" for "Best Political Blog" in 2012 and 2013. In 2016, while under the ownership of ESPN, FiveThirtyEight won the "Data Journalism Website of the Year" award.
The website's logo depicts a fox, in reference to a phrase attributed to Archilochus: "The fox knows many things, but the hedgehog knows one big thing."
Genesis and history
When Silver started FiveThirtyEight.com in early March 2008, he published under the name "Poblano", the same name that he had used since November 2007 when he began publishing a diary on the political blog Daily Kos. Writing as Poblano on Daily Kos, he had gained a following, especially for his primary election forecast on Super Tuesday, February 5, 2008. From that primary election day, which included contests in 24 states plus American Samoa, "Poblano" predicted that Barack Obama would come away with 859 delegates, and Hillary Clinton 829; in the final contests, Obama won 847 delegates and Clinton 834. Based on this result, New York Times op-ed columnist William Kristol wrote: "And an interesting regression analysis at the Daily Kos Web site (poblano.dailykos.com) of the determinants of the Democratic vote so far, applied to the demographics of the Ohio electorate, suggests that Obama has a better chance than is generally realized in Ohio".
FiveThirtyEight.com gained further national attention for beating out most pollsters' projections in the North Carolina and Indiana Democratic party primaries on May 6, 2008. As Mark Blumenthal wrote in National Journal, "Over the last week, an anonymous blogger who writes under the pseudonym Poblano did something bold on his blog, FiveThirtyEight.com. He posted predictions for the upcoming primaries based not on polling data, but on a statistical model driven mostly by demographic and past vote data.... Critics scoffed. Most of the public polls pointed to a close race in North Carolina.... But a funny thing happened. The model got it right". Silver relied on demographic data and on the history of voting in other states during the 2008 Democratic primary elections. "I think it is interesting and, in a lot of ways, I'm not surprised that his predictions came closer to the result than the pollsters did", said Brian F. Schaffner, research director of American University's Center for Congressional and Presidential Studies.
On May 30, 2008, Silver revealed his true identity for the first time to his FiveThirtyEight.com readers. After that date, he published just four more diaries on Daily Kos.
As the primary season was coming to an end, Silver began to build a model for the general election race. This model, too, relied in part on demographic information but mainly involved a complex method of aggregating polling results. In 2008, Rasmussen Reports had an apparently short-term partnership with FiveThirtyEight.com in order to include this unique methodology for generating poll averages in their "Balance of Power Calculator". At the same time, FiveThirtyEight.com's daily "Today's Polls" column began to be mirrored on "The Plank," a blog published by The New Republic.
By early October 2008, FiveThirtyEight.com approached 2.5 million visitors per week, while averaging approximately 400,000 per weekday. During October 2008 the site received 3.63 million unique visitors, 20.57 million site visits, and 32.18 million page views. On Election Day, November 4, 2008, the site had nearly 5 million page views.
On June 3, 2010, Silver announced that in early August the blog would be "relaunched under a NYTimes.com domain". The transition took place on August 25, 2010, with the publication of Silver's first FiveThirtyEight blog article online in The New York Times.
In July 2013, it was revealed that Silver and his FiveThirtyEight blog would depart The New York Times and join ESPN. In its announcement of its acquisition of FiveThirtyEight, ESPN reported that "Silver will serve as the editor-in-chief of the site and will build a team of journalists, editors, analysts and contributors in the coming months. Much like Grantland, which ESPN launched in 2011, the site will retain an independent brand sensibility and editorial point-of-view, while interfacing with other websites in the ESPN and Disney families. The site will return to its original URL, www.FiveThirtyEight.com".
According to Silver, the focus of FiveThirtyEight in its ESPN phase would broaden: "People also think it’s going to be a sports site with a little politics thrown in, or it’s going to be a politics site with sports thrown in.... But we take our science and economics and lifestyle coverage very seriously.... It’s a data journalism site. Politics is one topic that sometimes data journalism is good at covering. It’s certainly good with presidential elections. But we don’t really see politics as how the site is going to grow".
FiveThirtyEight launched its ESPN webpage on March 17, 2014. The lead story by Nate Silver explained that "FiveThirtyEight is a data journalism organization.... We’ve expanded our staff from two full-time journalists to 20 and counting. Few of them will focus on politics exclusively; instead, our coverage will span five major subject areas – politics, economics, science, life and sports. Our team also has a broad set of skills and experience in methods that fall under the rubric of data journalism. These include statistical analysis, but also data visualization, computer programming and data-literate reporting. So in addition to written stories, we’ll have interactive graphics and features".
Weighting of polls
One unique aspect of the site is Silver's efforts to rank pollsters by accuracy, weight their polls accordingly, and then supplement those polls with his own electoral projections based on demographics and prior voting patterns. "I did think there was room for a more sophisticated way of handling these things," Silver said.
FiveThirtyEight.com weighs pollsters' historical track records through a complex methodology and assigns them values to indicate "Pollster-Introduced Error".
Polls on FiveThirtyEight.com are weighted using a half-life of thirty days using the formula 0.5P/30 where 'P' is the number of days transpired since the median date that the poll was in the field. The formula is based on an analysis of 2000, 2004, 2006 and 2008 state-by-state polling data.
Smoothing the poll results
At base Silver's method is similar to other analysts' approaches to taking advantage of the multiple polls that are conducted within each state: he averaged the polling results. But especially in the early months of the election season polling in many states is sparse and episodic. The "average" of polls over an extended period (perhaps several weeks) would not reveal the true state of voter preferences at the present time, nor provide an accurate forecast of the future. One approach to this problem was followed by Pollster.com: if enough polls were available, it computed a locally weighted moving average or LOESS.
However, while adopting such an approach in his own analysis, Silver reasoned that there was additional information available in polls from "similar" states that might help to fill the gaps in information about the trends in a given state. Accordingly, he adapted an approach that he had previously used in his baseball forecasting: using nearest neighbor analysis he first identified "most similar states" and then factored into his electoral projections for a given state the polling information from "similar states". He carried this approach one step further by also factoring national polling trends into the estimates for a given state. Thus, his projections were not simply based on the polling trends in a given state.
Furthermore, a basic intuition that Silver drew from his analysis of the 2008 Democratic party primary elections was that the voting history of a state or Congressional district provided clues to current voting. This is what allowed him to beat all the pollsters in his forecasts in the Democratic primaries in North Carolina and Indiana, for example. Using such information allowed Silver to come up with estimates of the vote preferences even in states for which there were few if any polls. For his general election projections for each state, in addition to relying on the available polls in a given state and "similar states," Silver estimated a "538 regression" using historical voting information along with demographic characteristics of the states to create an estimate that he treated as a separate poll (equivalent to the actually available polls from that state). This approach helped to stabilize his projections, because if there were few if any polls in a given state, the state forecast was largely determined by the 538 regression estimate.
Additional aspects of the methodology are described in a detailed FAQ on the FiveThirtyEight.com website.
Senate races
In July 2008, the site began to report regular updates of projections of 2008 U.S. Senate races. Special procedures were developed relying on both polls and demographic analysis. The projections were updated on a weekly basis.
Swing state analysis
The site presents an analysis of the swing states, focusing on so-called "Tipping Point States". 'Tipping Point States' are those states that tip the outcome of the election from one candidate to the other. In each simulation run, the winner's states won are lined up in reverse order of victory margin by percentage. A simple algorithm selects the minimum closest states that, if switched to the loser's side, would change the election outcome, then weights that run's significance based on the margin of victory in the popular vote. Thus, the closer the popular vote, the fewer the number of tipping point states and the greater the significance of that run in assessing tipping point importance. For example, the 2004 election's sole tipping point state was Ohio by this method, while 1960s were Illinois, Missouri, and New Jersey – even though Hawaii was the closest state race.
Final projections of 2008 elections
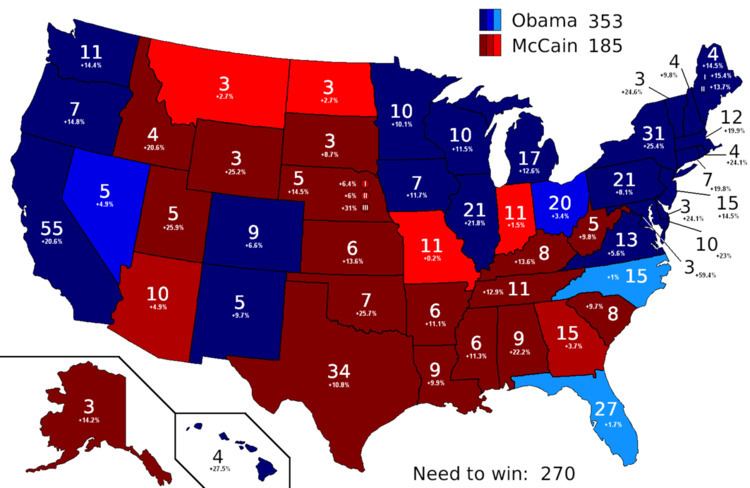
In the final update of his presidential forecast model at midday of November 4, 2008, Silver projected a popular vote victory by 6.1 percentage points for Barack Obama and electoral vote totals of 349 (based on a probabilistic projection) or 353 (based on fixed projections of each state). Obama won with 365 electoral college votes. Silver's predictions matched the actual results everywhere except in Indiana and the 2nd congressional district of Nebraska, which awards an electoral vote separately from the rest of the state. His projected national popular vote differential was below the actual figure of 7.2 points.
The forecasts for the Senate proved to be correct for every race. But the near stalemate in Minnesota led to a recount that was settled only on June 30, 2009. In Alaska, after a protracted counting of ballots, on November 19 Republican incumbent Ted Stevens conceded the seat to Democrat Mark Begich, an outcome that Silver had forecast on election day. And in Georgia, a run-off election on December 2 led to the re-election of Republican Saxby Chambliss, a result that was also consistent with Silver's original projection.
Focus
During the first two months after the election, no major innovations in content were introduced. A substantial percentage of the articles focused on Senatorial races: the runoff in Georgia, won by Saxby Chambliss; recounts of votes in Alaska (won by Mark Begich), and Minnesota (Al Franken vs. Norm Coleman); and the appointments of Senatorial replacements in Colorado, New York, and Illinois.
After President Obama's inauguration, Sean Quinn reported that he was moving to Washington, D.C., to continue political writing from that locale. On February 4, 2009, he became the first blogger to join the White House press corps. After that time, however, he contributed only a handful of articles to FiveThirtyEight.com.
During the post-2008 election period Silver devoted attention to developing some tools for the analysis of forthcoming 2010 Congressional elections, as well as discussing policy issues and the policy agenda for the Obama administration, especially economic policies. He developed a list of 2010 Senate races in which he made monthly updates of predicted party turnover.
Later, Silver adapted his methods to address a variety of issues of the day, including health care reform, climate change, unemployment, and popular support for same-sex marriage. He wrote a series of columns investigating the credibility of polls by Georgia-based firm Strategic Vision, LLC. According to Silver's analysis, Strategic Vision's data displayed statistical anomalies that were inconsistent with random polling. Later, he uncovered indirect evidence that Strategic Vision may have gone as far as to fabricate the results of a citizenship survey taken by Oklahoma high school students. FiveThirtyEight devoted more than a dozen articles to the Iranian presidential election in June 2009, assessing of the quality of the vote counting. International affairs columnist Renard Sexton began the series with an analysis of polling leading up to the election; then posts by Silver, Andrew Gelman and Sexton analyzed the reported returns and political implications.
FiveThirtyEight covered the November 3, 2009, elections in the United States in detail. FiveThirtyEight writers Schaller, Gelman, and Silver also gave extensive coverage to the January 19, 2010 Massachusetts special election to the U.S. Senate. The "538 model" once again aggregated the disparate polls to correctly predict that the Republican Scott Brown would win.
In spring of 2010, FiveThirtyEight turned a focus on the United Kingdom General Election scheduled for May 6, with a series of more than forty articles on the subject that culminated in projections of the number of seats that the three major parties were expected to win. Following a number of preview posts in January, and February, Renard Sexton examined subjects such as the UK polling industry and the 'surge' of the third-party Liberal Democrats, while Silver, Sexton and Dan Berman developed a seat projection model. The UK election was the first time the FiveThirtyEight team did an election night 'liveblog' of a non-US election.
In April 2010, the Guardian Newspaper published Silver's predictions for the 2010 United Kingdom General Election. The majority of polling organisations in the UK use the concept of uniform swing to predict the outcome of elections. However, by applying his own methodology, Silver produced very different results, which suggested that a Conservative victory might have been the most likely outcome. After a series of articles, including critiques and responses to other electoral analysts, his "final projection" was published on the eve of the election. In the end, Silver's projections were off the mark, particularly compared with those of some other organizations, and Silver wrote a post mortem on his blog. Silver examined the pitfalls of the forecasting process, while Sexton discussed the final government agreement between the Conservatives and the Liberal Democrats.
Controversy over transparency in pollster ratings
On June 6, 2010, FiveThirtyEight posted pollster rankings that updated and elaborated Silver's efforts from the 2008 election. Silver expanded the database to more than 4,700 election polls and developed a model for rating the polls that was more sophisticated than his original rankings.
Silver responded on 538: "Where's the transparency? Well, it's here [citing his June 6 article], in an article that contains 4,807 words and 18 footnotes. Every detail of how the pollster ratings are calculated is explained. It's also here [referring to another article], in the form of Pollster Scorecards, a feature which we'll continue to roll out over the coming weeks for each of the major polling firms, and which will explain in some detail how we arrive at the particular rating that we did for each one".
As for why the complete 538 polling database had not been released publicly, Silver responded: "The principal reason is because I don't know that I'm legally entitled to do so. The polling database was compiled from approximately eight or ten distinct data sources, which were disclosed in a comment which I posted shortly after the pollster ratings were released, and which are detailed again at the end of this article. These include some subscription services, and others from websites that are direct competitors of this one. Although polls contained in these databases are ultimately a matter of the public record and clearly we feel as though we have every right to use them for research purposes, I don't know what rights we might have to re-publish their data in full".
Silver also commented on the fact that the 538 ratings had contributed to Markos Moulitsas's decision to end Daily Kos's use of Research 2000 as its pollster.
Subsequently, on June 11, Mark Blumenthal also commented on the question of transparency in an article in the National Journal titled "Transparency In Rating: Nate Silver's Impressive Ranking Of Pollsters' Accuracy Is Less Impressive In Making Clear What Data Is Used". He noted that in the case of Research 2000 there were some discrepancies between what Silver reported and what the pollster itself reported. Other researchers questioned aspects of the methodology.
On June 16, 2010, Silver announced on his blog that he is willing to give all pollsters who he had included in his rating a list of their polls that he had in his archive, along with the key information that he used (poll marginals, sample size, dates of administration); and he encouraged the pollsters to examine the lists and the results to compare them with the pollster's own record and make corrections.
In September, 2014, Silver put into the public domain all of his pollster ratings, as well as descriptive summary data for all of the more than 6,600 polls in his data collection for the final three weeks of U.S. Presidential primaries and general elections, state governor elections, and U.S. Senate and U.S. Congress elections for the years 1998–2012. In addition to updating his pollster ratings, he published an updated methodological report.
Partnership with The New York Times: 2010–2013
On June 3, 2010, The New York Times and Silver announced that FiveThirtyEight had formed a partnership under which the blog would be hosted by the Times for a period of three years. In legal terms, FiveThirtyEight granted a "license" to the Times to publish the blog. The blog would be listed under the "Politics" tab of the News section of the Times. FiveThirtyEight would thus be subject to and benefit from editing and technical production by the Times, while FiveThirtyEight would be responsible for creating the content.
Silver received bids from several major media entities before selecting the Times. Under terms of the agreement, Silver would also write monthly articles for the print version of both the newspaper and the Sunday magazine. Silver did not move his blog to the highest bidder, because he was concerned with maintaining his own voice while gaining the exposure and technical support that a larger media company could provide. "There's a bit of a Groucho Marx quality to it [Silver has said].... You shouldn't want to belong to any media brand that seems desperate to have you as a member, even though they'll probably offer the most cash".
The first column of the renamed FiveThirtyEight: Nate Silver's Political Calculus appeared in The Times on August 25, 2010, with the introduction of U.S. Senate election forecasts. At the same time, Silver published a brief history of the blog. All columns from the original FiveThirtyEight.com were also archived for public access.
Writers
When the transition to The New York Times was announced, Silver listed his staff of writers for the first time. However, of the seven listed writers, only three of them had published on 538/New York Times by late December 2010: Silver, Renard Sexton and Hale Stewart. Andrew Gelman contributed again in early 2011. Brian McCabe published his first article in January 2011.
Beginning in 2011, one writer who emerged as a regular contributor was Micah Cohen. Cohen provided a periodic "Reads and Reactions" column in which he summarized Silver's articles for the previous couple of weeks, as well as reactions to them in the media and other blogs, and suggested some additional readings related to the subject of Silver's columns. Silver identified Cohen as "my news assistant". Cohen also contributed additional columns on occasion.
On September 12, 2011, Silver introduced another writer: "FiveThirtyEight extends a hearty welcome to John Sides, a political scientist at George Washington University, who will be writing a series of posts for this site over the next month. Mr. Sides is also the founder of the blog The Monkey Cage, which was named the 2010 Blog of the Year by The Week magazine".
In 2016, Columbia Journalism Review published information on Harry Enten and identified him as the "whiz kid" of FiveThirtyEight and an example of a new generation of political journalists who are very analytical and data-based.
Sports
While politics and elections remained the main focus of FiveThirtyEight, the blog also sometimes addressed sports, including the March Madness and the 2012 NCAA Men's Basketball tournament selection process, the B.C.S. rankings in NCAA college football, the NBA, and Major League Baseball matters ranging from the 2011 attendance at the New York Mets' Citi Field to the historic 2011 collapse of the Boston Red Sox.
Economics and hurricanes
In addition, FiveThirtyEight sometimes turned its attention to other topics, such as the economics of blogging, the financial ratings by Standard & Poors, economists' tendency to underpredict unemployment levels, and the economic impact and media coverage of Hurricane Irene (2011).
Occupy Wall Street protests
FiveThirtyEight published a graph showing different growth curves of the news stories covering Tea Party and Occupy Wall Street protests. Silver pointed out that conflicts with the police caused the sharpest increases in news coverage of the protests. And he assessed the geography of the protests by analyzing news reports of the size and location of events across the United States.
2010 U.S. mid-term elections
Shortly after 538 relocated to The New York Times, Silver introduced his prediction models for the 2010 elections to the U.S. Senate, the U.S. House of Representatives, and state Governorships. Each of these models relied initially on a combination of electoral history, demographics, and polling.
U.S. Senate
Stimulated by the surprising win of Massachusetts Republican Scott Brown in the special election in January 2010, Silver launched the first iteration of his Senate prediction model a few days later, using objective indicators including polling to project each state outcome in November. This model incorporated some elements of the 2008 presidential model. It was first published in full form in The New York Times on August 25, 2010. It relied basically on aggregating of public polls for each Senate race, with some adjustment for national trends in recognition of a correlation in poll movement across state lines, i.e., each race cannot be interpreted as entirely independent of all others.
In addition to making projections of the outcomes of each Senate race, FiveThirtyEight tracked the expected national outcome of the partisan division of the Senate. Just before election day (October 31), the FiveThirtyEight Senate projection was for the new Senate to have 52 Democrats and 48 Republicans. (The model did not address the possibility of party switching by elected candidates after November 2.)
Of the 37 Senate seats contested in the November 2, 2010 elections, 36 were resolved by November 4, including very close outcomes in several states. Of these 36, the FiveThirtyEight model had correctly predicted the winner in 34. One of the two misses was in Colorado, in which the incumbent Michael Bennet (D) outpolled the challenger Ken Buck (R) by less than 1 percentage point. The 538 model had forecast that Buck would win by 1 percentage point. The second miss was in Nevada, in which the incumbent Harry Reid beat challenger Sharron Angle by 5.5 percentage points, whereas the 538 model had forecast Angle to win by 3.0 percentage points. Silver has speculated the error was due at least in part to the fact that polling organizations underrepresented Hispanic voters by not interviewing in Spanish.
In the remaining contest for U.S. Senate, in Alaska, the electoral outcome was not yet determined as of November 4, pending a count of the write-in ballots, but in the end the FiveThirtyEight forecast of GOP nominee Joe Miller as winner ultimately proved to be wrong, as write-in candidate, incumbent Republican Senator Lisa Murkowski, prevailed.
The 538 model had forecast a net pickup of 8 seats by the Republicans in the Senate, but the outcome was a pickup of 6 seats.
U.S. House of Representatives
The model for projecting the outcome of the House of Representatives was more complicated than those for the Senate and governorships. For one thing, House races are more subject to the force of national trends and events than are the other two. One way to account for this was to take into account trends in the "generic Congressional ballot." Use of such a macrolevel indicator, as well as macroeconomic indicators, is a common approach taken by political scientists to project House elections.
Furthermore, there was much less available public polling for individual House districts than there is for Senate or gubernatorial races. By the end of the 2010 election season, public polls were available for only about 25% of the districts. This is one reason why some analysts rely principally on making global or macro-level projections of the number of seats to be won by each party rather than trying to forecast the outcome in every individual district. Silver's FiveThirtyEight model, however, while weighting the generic partisan division as one factor, focused on developing estimates for each district. For this purpose he used information on past voting in the district (the Cook PVI), the quality of the candidates (in particular whether one was an incumbent), fundraising by each candidate, "expert ratings" of the races, public polls of the given race (if they were available), and, in the absence of public polls a cautious use of private polls (i.e., polls conducted by or for partisan organizations or a candidate's own campaign organization).
In response to some concerns that he was hedging his projection, Silver contended that in his model the uncertainty of the outcome was a feature, not a flaw. In comparison with previous Congressional elections, a far larger number of seats were being contested or were "in play" in 2010. While his model, which relied on simulating the election outcomes 100,000 times generated a projected "most likely" net gain of 53 seats by the Republicans (two days before the election), he emphasized that the 95% confidence interval was ± 29–30: "Tonight, our forecast shows Republicans gaining 53 seats – the same as in recent days, and exactly the same answer you get if you plug the generic ballot average into the simple formula. Our model also thinks the spread of potential outcomes is exceptionally wide: its 95 percent confidence interval runs from a 23-seat Republican gain to an 81-seat one".
On election eve, he reported his final forecast as follows:
Our forecasting model, which is based on a consensus of indicators including generic ballot polling, polling of local districts, expert forecasts, and fund-raising data, now predicts an average Republican net gain of 54 seats (up one from 53 seats in last night's forecast), and a median net Republican gain of 55 seats. These figures would exceed the 52 seats that Republicans won from Democrats in the 1994 midterms.
In final vote tallys as of December 10, 2010, the Republicans had a net gain of 63 seats in the House, 8 more than the total predicted on election eve though still within the reported confidence interval.
State governorships
The FiveThirtyEight model for state governors' races also relied basically on aggregating and projecting public polls in each race. However, Silver reported that gubernatorial elections in each state were somewhat more independent of what happened in other states than were either Senate or House of Representatives elections. That is, these races were somewhat more local and less national in focus.
Just before election day (October 31), the FiveThirtyEight projection was that there would be 30 Republican governors in office (counting states where there was no gubernatorial election in 2010), 19 Democratic governors, and 1 (actually 0.8) Other (Lincoln Chafee, who was leading in the polls running as an Independent in Rhode Island).
Of the 37 gubernatorial races, FiveThirtyEight correctly predicted the winner of 36. Only in Illinois, in which the Democratic candidate Pat Quinn defeated the Republican Bill Brady 46.6% to 46.1%, was the FiveThirtyEight prediction wrong.
2012 U.S. elections
While FiveThirtyEight devoted a lot of time to coverage of the 2012 Republican party primaries throughout 2011, its first effort to handicap the 2012 Presidential general election was published a year in advance of the election. Accompanying the online release of this article, Silver also published online "Choose Obama's Re-Election Adventure," an interactive feature that allowed readers to predict the outcome of the election based on their assumptions about three variables: President Obama's favorability ratings, the rate of GDP growth, and how conservative the Republican opponent would be. In February 2012 Silver updated his previous Magazine story with another one, "Why Obama Will Embrace the 99 Percent". This article painted a more optimistic picture of Obama's re-election chances. Another article, "The Fundamentals Now Favor Obama," explained how the model and Obama's prospects had changed between November and February.
Silver published election projections for the presidency and the U.S. Senate, but not for the U.S. House of Representatives in 2012. When asked why he did not produce House forecasts in 2012, Silver responded: "There was nothing particularly deep about this choice. We just ran out of time to implement a House model this year, and I'd rather do fewer things well than get spread too thin and not be able to support the product. We'd expect to have House forecasts in 2014".
Presidential primary elections
On December 13, 2011, Silver published his first version of a primary election forecast for the Republican Party Iowa Caucuses. In this article he also described the basic methodology for forecasting the primaries; his approach relied solely on an adjusted average of state-level polls, and not on any other information about the campaign or on national polls. Silver later analyzed the prospects and results of each Republican caucus and primary. He maintained and regularly updated a set of vote projections, applying his aggregation methodology to the available polls. In keeping with a concern for the uncertainty of the forecasts, his projections showed both a point estimate and a confidence interval of the vote percentage projected for each candidate.
Presidential general election
Silver rolled out the first iteration of his 2012 general election forecasting model on June 7, 2012. The model forecasts both the popular vote and the electoral college vote, with the latter being central to the exercise and involving a forecast of the electoral outcome in each state.
The forecast works by running simulations of the Electoral College, which are designed to consider the uncertainty in the outcome at the national level and in individual states. It recognizes that voters in each state could be affected by universal factors – like a rising or falling economic tide – as well as by circumstances particular to each state. Furthermore, it considers the relationships between the states and the ways they might move in tandem with one another. Demographically similar states like Minnesota and Wisconsin, for instance, are more likely to move in the same direction than dissimilar ones like New Hampshire and New Mexico.
Although the model – which is distinct from the electoral map put together by The Times's political desk – relies fairly heavily on polling, it also considers an index of national economic conditions.
In the initial forecast, Barack Obama was estimated to win 291.3 electoral votes, compared to 246.7 by Mitt Romney. This was consistent with Obama having a 61.8% chance of winning the electoral vote in November 2012. Obama was forecast to win 50.5% of the popular vote, compared to 49.4% by Romney.
The website provided maps and statistics about the electoral outcomes in each state as well as nationally. Later posts addressed methodological issues such as the "house effects" of different pollsters as well as the validity of telephone surveys that did not call cell phones.
Through the general election campaign, the blog tracked the movement in the projected electoral vote for Mitt Romney and Barack Obama. In the process it drew an enormous amount of traffic to The New York Times. On election night, November 6, it was reported that "Silver’s blog provided a significant – and significantly growing, over the past year – percentage of Times pageviews. This fall, visits to the Times’ political coverage (including FiveThirtyEight) have increased, both absolutely and as a percentage of site visits. But FiveThirtyEight’s growth is staggering: where earlier this year, somewhere between 10 and 20 percent of politics visits included a stop at FiveThirtyEight, last week that figure was 71 percent.... But Silver’s blog has buoyed more than just the politics coverage, becoming a significant traffic-driver for the site as a whole. Earlier this year, approximately 1 percent of visits to the New York Times included FiveThirtyEight. Last week, that number was 13 percent. Yesterday, it was 20 percent. That is, one in five visitors to the sixth-most-trafficked U.S. news site took a look at Silver’s blog". "On Election Day, the blog drew 10 million page views.... In the first week of its existence in 2008, the blog only got about 300 hits".
From the middle of 2012 until election day, the FiveThirtyEight model updated its estimates of the probability that Barack Obama and Mitt Romney would win a majority of the electoral votes. On election day, November 6, Silver posted his final forecast for each state. On the morning of the November 6, 2012 presidential election, Silver's model gave President Barack Obama a 90.9% chance of winning a majority of the electoral votes. At the end of that day, after the ballots had been counted, the 538 model had correctly predicted the winner of all 50 states and the District of Columbia. Silver, along with at least two academic-based analysts who aggregated polls from multiple pollsters, thus got not only all 50 state predictions right, but also all 9 of the "swing states". In contrast, individual pollsters were less successful. For example, Rasmussen Reports "missed on six of its nine swing-state polls".
An independent analysis of Silver's state-by-state projections, assessing whether the percentages of votes that the candidates actually received fell within the "margin of error" of Silver's forecasts, found that "Forty-eight out of 50 states actually fell within his margin of error, giving him a success rate of 96 percent. And assuming that his projected margin of error figures represent 95 percent confidence intervals, which it is likely they did, Silver performed just about exactly as well as he would expect to over 50 trials. Wizard, indeed". Additional tests of the accuracy of the electoral vote predictions were published by other researchers.
Criticism of presidential forecasts
In a series of posts in 2011 and 2012, FiveThirtyEight criticized the forecasting methods that relied on macro-economic modeling of the electoral outcomes. According to Silver, models based primarily on the macro-level performance of the economy (such as unemployment, inflation, and the performance of the stock market), presidential approval ratings (when an incumbent is running for re-election), and the ideological positioning of the (potential) opposing candidates were useful for making forecasts of the election outcome well in advance of election day, though not very precise ones.
An article stating such a position published exactly one year before election day 2012 was attacked in an online article in Bloomberg News by Ron Klain, the former chief-of-staff to Vice President Biden and a political advisor to Barack Obama. Nate Silver wrote a defense of his method in response. Silver's response was followed by another one from Klain: "Respectfully, Silver Is Still Wrong," as well as by comments from others on Silver's article and the debate with Klain.
In late October and early November 2012, a number of conservative political journalists issued criticisms of Nate Silver's predictions as overly biased towards Barack Obama's chances of being re-elected president. Dean Chambers criticized Nate Silver and issued his own "unskewed" prediction of the election. This prediction ultimately erred on four swing states and missed Barack Obama's popular vote percentage by 1.7%, while Nate Silver correctly predicted all 50 states and missed Barack Obama's popular vote percentage by 0.3%. Dean Chambers admitted that his assumptions about voter turnout were incorrect and that the pollsters' assumptions were very accurate.
During the final weeks prior to the November 6th election, some pundits also criticized Silver's electoral model for conveying an undue sense of predictability to the outcome as well as a conviction that Barack Obama was ahead in the race and had a 75% probability of winning. For example, New York Times op-ed columnist David Brooks wrote, "I know ... how I should treat polling data. First, I should treat polls as a fuzzy snapshot of a moment in time. I should not read them, and think I understand the future. If there's one thing we know, it’s that even experts with fancy computer models are terrible at predicting human behavior".
In a more direct attack on Silver, in an article entitled "Nate Silver: One-term celebrity?" Dylan Byers of Politico wrote, "For all the confidence Silver puts in his predictions, he often gives the impression of hedging. Which, given all the variables involved in a presidential election, isn't surprising. For this reason and others – and this may shock the coffee-drinking NPR types of Seattle, San Francisco and Madison, Wis. – more than a few political pundits and reporters, including some of his own colleagues, believe Silver is highly overrated." Byers also quoted this comment by Joe Scarborough on MSNBC's Morning Joe: "Nate Silver says this is a 73.6 percent chance that the president is going to win? Nobody in that campaign thinks they have a 73 percent chance – they think they have a 50.1 percent chance of winning. And you talk to the Romney people, it's the same thing," Scarborough said. "Both sides understand that it is close, and it could go either way. And anybody that thinks that this race is anything but a toss-up right now is such an ideologue, they should be kept away from typewriters, computers, laptops and microphones for the next 10 days, because they're jokes".
In contrast to these critics, in late October 2012 political science professor Samuel L. Popkin of the University of California, San Diego, had evaluated Silver's electoral projections as follows:
We're heading into the last week of a tight presidential campaign, and polls are coming in too fast to count. Partisans everywhere are desperate for omens. But at moments like these, it's people who care most intensely that the "right outcome" occur who run a high risk of getting it wrong – picking out positive polls for comfort, or panicking over an unusual and unexpected result they don’t like.
Fortunately, our most prominent number cruncher has been giving us the straight story instead of capitalizing on this anxiety. In 2008, Nate Silver correctly predicted the results of all 35 Senate races and the presidential results in 49 out of 50 states. Since then, his website, fivethirtyeight.com (now central to The New York Times's political coverage), has become an essential source of rigorous, objective analysis of voter surveys to predict the Electoral College outcome of presidential campaigns.
After a post-election appearance by Silver on Joe Scarborough's Morning Joe, Scarborough published what he called a "(semi) apology," in which he concluded:
I won't apologize to Mr. Silver for predicting an outcome that I had also been predicting for a year. But I do need to tell Nate I'm sorry for leaning in too hard and lumping him with pollsters whose methodology is as rigorous as the Simpsons' strip mall physician, Dr. Nick. For those sins (and a multitude of others that I'm sure I don’t even know about), I am sorry.
Politics is a messy sport. And just as ball players who drink beer and eat fried chicken in dugouts across America can screw up the smartest sabermatrician’s forecast, Nate Silver's formula is sure to let his fervent admirers down from time to time. But judging from what I saw of him this morning, Nate is a grounded guy who admits as much in his book. I was too tough on him and there’s a 84.398264% chance I will be less dismissive of his good work in the future.
U.S. Senate elections
The FiveThirtyEight model correctly forecasted the outcome of 31 of the 33 U.S. Senate races.
In one unexpected result, the model had estimated that Republican Rick Berg had a 92% chance of winning the Senate seat in North Dakota. However, by a vote margin of less than 1 percentage point, Democrat Heidi Heitkamp won the election. When asked about his forecast in an online chat a week after the election, Silver said: "The polls showed Berg a little bit ahead. But also there weren't very many polls, so the model defaults in those cases toward looking at "state fundamentals", i.e. the fact that you'd bet on the Republican in North Dakota other things being equal. That race should also serve as a reminder that we put the probabilities in our forecasts for a reason. We had Heitkamp with a 8% chance of winning, I think, about the same as we gave Romney. Those 8% chances come up sometimes... they come up 8% of the time, in fact".
In the other unexpected result, the model had estimated that Montana Republican challenger Denny Rehberg had a 66% chance to defeat the Democratic incumbent Jon Tester; but Tester prevailed and kept his seat.
Under ESPN ownership
FiveThirtyEight launched its ESPN-owned stage on March 17, 2014. As of July, it had a staff of 20 writers, editors, data visualization specialists, and others. By March 2016, this staff had nearly doubled to 37 listed on the masthead, and 7 listed as contributors. The site produced articles under 5 headings: politics, economics, science and health, (cultural) life, and sports. In addition to feature articles it produced podcasts on a range of subjects.
Monthly traffic to the site grew steadily from about 2.8 million unique visitors in April 2014 to 10.7 million unique visitors in January 2016.
2014 U.S. elections
On September 3, 2014, FiveThirtyEight introduced its forecasts for each of the 36 U.S. Senate elections being contested that year. At that time, the Republican Party was given a 64 percent chance of holding a majority of the seats in the Senate after the election. However, FiveThirtyEight editor Nate Silver also remarked, "An equally important theme is the high degree of uncertainty around that outcome. A large number of states remain competitive, and Democrats could easily retain the Senate". About two weeks later, the forecast showed the Republican chances of holding the majority down to 55 percent.
2016 Oscars predictions
FiveThirtyEight sought to apply its mathematical models to the Oscars, and produced internal predictions regarding the subject, guessing four out of six categories correctly. The website also compiled a list of other predictions made by other people using different methods.
Presidential primary elections
FiveThirtyEight applied two separate models to forecast the 2016 Presidential Primary elections – Polls-Only and Polls-Plus models. The polls-only model relied only on polls from a particular state, while the polls-plus model was based on state polls, national polls and endorsements. For each contest, FiveThirtyEight produced probability distributions and average expected vote shares per both of these models.
As early as June 2015, FiveThirtyEight argued that Donald Trump "isn't a real candidate" and maintained that Trump could not win the nomination until late in the election season. When Donald Trump became the presumptive Republican nominee in May 2016, New York Times media columnist Jim Rutenberg wrote that "predictions can have consequences" and criticized FiveThirtyEight for underestimating Trump's chances. He argued that by giving "Mr. Trump a 2 percent chance at the nomination despite strong polls in his favor...they also arguably sapped the journalistic will to scour his record as aggressively as those of his supposedly more serious rivals".
In a long retrospective "How I Acted Like A Pundit And Screwed Up On Donald Trump," published in May 2016 after Trump had become the likely nominee, Silver reviewed how he had erred in evaluating Trump's chances early in the primary campaign. Silver wrote, "The big mistake is a curious one for a website that focuses on statistics. Unlike virtually every other forecast we publish at FiveThirtyEight – including the primary and caucus projections I just mentioned – our early estimates of Trump’s chances weren’t based on a statistical model. Instead, they were what we [call] 'subjective odds' – which is to say, educated guesses. In other words, we were basically acting like pundits, but attaching numbers to our estimates. And we succumbed to some of the same biases that pundits often suffer, such as not changing our minds quickly enough in the face of new evidence. Without a model as a fortification, we found ourselves rambling around the countryside like all the other pundit-barbarians, randomly setting fire to things".
On the Democratic side, FiveThirtyEight argued that Sen. Bernie Sanders could "lose everywhere else after Iowa and New Hampshire" and that the "Democratic establishment would rush in to squash" him if he doesn't. As Sanders won 22 primaries and caucuses, this was clearly wrong.
Fairness and Accuracy in Reporting, a media watch group, wrote in May 2016 that FiveThirtyEight "sacrificed its integrity to go after Sanders" and that they have "at times gone beyond the realm of punditry into the realm of hackery – that is, not just treating their own opinions as though they were objective data, but spinning the data so that it conforms to their opinions."
FiveThirtyEight's predictions for each state primary, both for the Republican and the Democratic party nominations, were based on statistical analysis, not on the analyst's opinions. The core data employed were polls, which FiveThirtyEight aggregated for each state (while also considering national polls) using essentially the same method it had employed since 2008. In the 2016 primaries, the projections also took into account endorsements. The website also kept track of the accumulation of national party convention delegates. In a comparison of prediction success published by Bloomberg News after the primary season was completed, FiveThirtyEight's prediction success tied for the highest percentage of correct primary poll winners, at 92%; but it lagged behind PredictWise in predicting a larger set of primaries. Notably, even with FiveThirtyEight's track record of correctly predicting elections that pollsters get wrong, it still missed Bernie Sanders's upset victory in the Michigan primary, for instance, regarded as the 'one of the biggest upset in modern political history'.
Presidential general election
On October 11, 2016, FiveThirtyEight's Nate Silver released two maps of hypothetical electoral college outcomes for the 2016 Presidential election if only men voted and if only women voted. These charts received attention through their propagation on Twitter and other social networks.
The final prediction by FiveThirtyEight on the morning of election day (November 8th 2016) was at 10:41AM and had Hillary Clinton with a 71% chance to win the 2016 United States presidential election. while other major forecasters had predicted Clinton to win with at least an 85% to 99% probability. FiveThirtyEight's model pointed the possibility of an Electoral College-popular vote split widening in final weeks based on both Clinton's small lead in general polls, but also on Trump's improvement in swing states like Florida or Pennsylvania, mixed with Clinton's poor performing in several of those swing states in comparison with Obama's performing in 2012. The main issues pointed by the forecast model was the unbalance of Clinton's improvement in very populated states like Texas, Georgia (projected safe for Republican) and California (projected safe for Democrats); mixed with her inability to attract white voters without a college degree, an increasing demographic in swing states, in addition to a potential decline in turnout from minorities. In consequence, Clinton's probabilities to win the Electoral College weren't improving. Nate Silver also focused on state by state numbers in considered 'must-win' states like Ohio and Florida, plus a consideration of polls' margin of error in advantages of less than three points.
Donald Trump won the election. FiveThirtyEight projected a much higher probability of Donald Trump winning the presidency than other pollsters, a projection which was criticized by Ryan Grim of the Huffington Post as "unskewing" too much in favor of Trump. And while FiveThirtyEight expressed that "nonetheless, Clinton is probably going to win, and she could win by a big margin", the forecaster also made a point about the unreliability of poll trackers in some cases, about a considerable number of undecided voters and about the unpredictable outcome in traditional swing states.