The term dilution assay is generally used to designate a special type of bioassay in which one or more preparations (e.g. a drug) are administered to experimental units at different dose levels inducing a measurable biological response. The dose levels are prepared by dilution in a diluent that is inert in respect of the response. The experimental units can for example be cell-cultures, tissues, organs or living animals. The biological response may be quantal (e.g. positive/negative) or quantitative (e.g. growth). The goal is to relate the response to the dose, usually by interpolation techniques, and in many cases to express the potency/activity of the test preparation(s) relative to a standard of known potency/activity.
Dilution assays can be direct or indirect. In a direct dilution assay the amount of dose needed to produce a specific (fixed) response is measured, so that the dose is a stochastic variable defining the tolerance distribution. Conversely, in an indirect dilution assay the dose levels are administered at fixed dose levels, so that the response is a stochastic variable.
For a mathematical definition of a dilution assay an observation space U is defined and a function f : U → R so that the responses u ∈ U are mapped to the set of real numbers. It is now assumed that a function F exists which relates the dose z ∈ [ 0 , ∞ ) to the response
f ( u ) = F ( z ) + e in which e is an error term with expectation 0. F is usually assumed to be continuous and monotone. In situations where a standard preparation is included it is furthermore assumed that the test preparation T behaves like a dilution (or concentration) of the standard S
F T ( z ) = F S ( ρ z ) , for all
z where ρ > 0 is the relative potency of T . This is the fundamental assumption of similarity of dose-response curves which is necessary for a meaningful and unambiguous definition of the relative potency. In many cases it is convenient to apply a power transformation x = z λ with λ > 0 or a logarithmic transformation x = log ( z ) . The latter can be shown to be a limit case of λ ↓ 0 so if λ = 0 is written for the log transformation the above equation can be redefined as
F T ( x ) = F S ( ρ λ x ) , for all
x .
Estimates F ^ of F are usually restricted to be member of a well-defined parametric family of functions, for example the family of linear functions characterized by an intercept and a slope. Statistical techniques such as optimization by Maximum Likelihood can be used to calculate estimates of the parameters. Of notable importance in this respect is the theory of Generalized Linear Models with which a wide range of dilution assays can be modelled. Estimates of F may describe F satisfactorily over the range of doses tested, but they do not necessarily have to describe F beyond that range. However, this does not mean that dissimilar curves can be restricted to an interval where they happen to be similar.
In practice, F itself is rarely of interest. More of interest is an estimate of ρ or an estimate of the dose that induces a specific response. These estimates involve taking ratios of statistically dependent parameter estimates. Fieller's theorem can be used to compute confidence intervals of these ratios.
Some special cases deserve particular mention because of their widespread use: If F is linear and λ > 0 this is known as a slope-ratio model. If F is linear and λ = 0 this is known as a parallel line model. Another commonly applied model is the probit model where F is the cumulative normal distribution function, λ = 0 and e follows a binomial distribution.
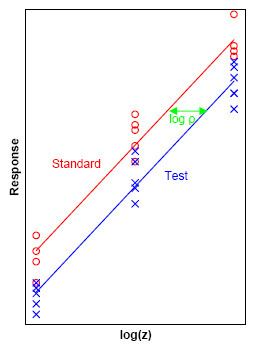
An antibiotic standard (shown in red) and test preparation (shown in blue) are applied at three dose levels to sensitive microorganisms on a layer of agar in petri dishes. The stronger the dose the larger the zone of inhibition of growth of the microorganisms. The biological response u is in this case the zone of inhibition and the diameter of this zone f ( u ) can be used as the measurable response. The doses z are transformed to logarithms x = log ( z ) and the method of least squares is used to fit two parallel lines to the data. The horizontal distance log ( ρ ^ ) between the two lines (shown in green) serves as an estimate of the potency ρ of the test preparation relative to the standard.
The major statistical software packages do not cover dilution assays although a statistician should not have difficulties to write suitable scripts or macros to that end. Several special purpose software packages for dilution assays exist.