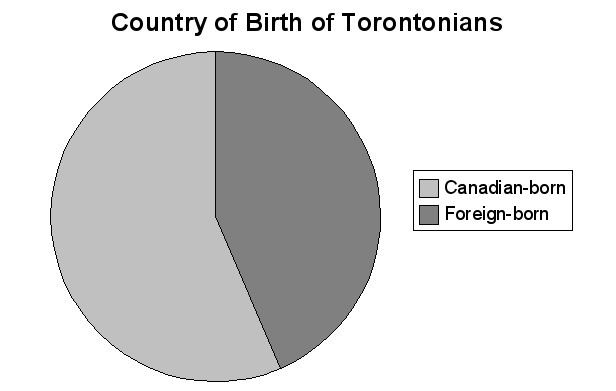
The demographics of Toronto, Ontario, Canada make Toronto one of the most multicultural cities in the world. Data released by Statistics Canada as part of the 2006 census indicated that 49.9% of Toronto's population is foreign-born. According to the 2011 National Household Survey (NHS) performed by Statistics Canada, that percentage had dropped - only slightly - to 48.6%.
The most common reported ethnic origins of Toronto residents are those from England (12.9%), China (12.0%), Canada (11.3%), Ireland (9.7%), Scotland (9.5%), India (7.6%), Italy (6.9%), the Philippines (5.5%), Germany (4.6%), France (4.5%), Poland (3.8%), Portugal (3.6%), and Jamaica (3.2%), or are of Jewish ethnic origin (3.1%). There is also a significant population of Ukrainians (2.5%), Russians (2.4%), Sri Lankans (2.3%), Spanish (2.2%), Greeks (2.2%), Koreans (1.5%), Dutch (1.5%), Iranians (1.4%), Vietnamese (1.4%), Pakistanis (1.2%), Hungarians (1.2%), Guyanese (1.1%), and Welsh (1.0%). Communities of Afghans, Albanians, Arabs, Barbadians, Bangladeshis, Bulgarians, Colombians, Croats, Ecuadorians, Ethiopians, Grenadians, Macedonians, Mexicans, Nepalis, Romanians, Salvadorans, Serbs, Somalis, Tibetans, Trinidadians, and Vincentians are also recognized. Established ethnic neighbourhoods such as Chinatown, Corso Italia, Little Italy, Little India, Greektown, Koreatown, Little Jamaica, Little Portugal and Roncesvalles celebrate the city's multiculturalism.
Christianity is the largest faith group in Toronto's census metropolitan area, adhered to by 56.7% of the population, with Roman Catholics in particular being 30.4% of the population. 21.1% of the population has no religious affiliation. Islam is the second most popular religion with 8.2% of the population, followed by Hinduism at 5.9%. As regards Protestant denominations, the Anglican Church accounts for 4.1% of the population, with the United Church of Canada only slightly lagging, at 3.7%. The Eastern stream of Christianity is adhered to by that 3.7% of the population of the Toronto CMA that are Christian Orthodox. Judaism is the religion of 3.0% of Torontonians, closely followed by Sikhism, which is the religion for 2.9% of the population; there are also 2.2% of residents of the Toronto CMA that are Buddhists. Protestant denominations such as Pentecostalism (1.8%), Presbyterianism (1.7%), and Baptists (1.5%) follow.
While English is the predominant language spoken by Torontonians, Statistics Canada reports that other language groups are significant, including Chinese varieties (particularly Cantonese and Mandarin), Italian, Punjabi, Spanish, Tagalog, Urdu, Tamil, Portuguese, Persian, Arabic, Russian, Polish, Gujarati, Korean, Vietnamese, and Greek. Canada's other official language, French, is spoken by 1.2% of the population.
Of the 25 City of Toronto MPs, 11 are of non-British/non-French origin, and in particular: Chinese (3), Jewish (2), East Indian (1), Iranian (1), Italian (1), Pakistani (1), Polish (1), Somali (1).
Taking into account the whole of GTA: East Indian (10), Chinese (4), Jewish (3), German (2), Iranian (2), Italian (2), Danish (1), Grenadian (1), Pakistani (1), Polish (1), Portuguese (1), Somali (1), Syrian (1).
The last complete census by Statistics Canada estimated there were 2,615,060 people living in Toronto, making it the largest city in Canada, and the fifth most populous municipality in North America.
Toronto's population grew by 1.0% from 2001 to 2006, with an annual growth rate of 0.2%. As of 2001, 17.5% of the population was 14 years and under, and 13.6% was 65 years and over; the median age was 36.9 years. Most recent studies show this has dropped to around 35.4 years of age, and the growth rate has increased to 0.4%.
2011 Census population data for the City of Toronto are to found readily aggregrated at a finer level than the city as a whole at i. the electoral district (riding) level (2003 redistribution) and ii. the neighbourhood level. The three ridings with the largest increase in population between 2006 and 2011 in the City of Toronto have been Trinity-Spadina (25.5%), Etobicoke-Lakeshore (7.3%), and Toronto Centre (7.3%); actually, the following four (4) ridings in the GTA have had a higher population increase even than Trinity-Spadina, and along with the aforementioned City of Toronto riding constitute the five (5) Ontario ridings with the highest increase in population: Oak Ridges-Markham (35.5%), Halton (33.9%), Vaughan (27.1%), and Bramalea-Gore-Malton (25.8%). On the contrary, the population in the Davenport riding actually decreased (-2.2%), whereas in Scarborough-Agincourt (+0.2%) and Toronto-Danforth (+0.3%) it only marginally increased (these are the lowest figures for the GTA at large too).
The neighbourhoods in the City of Toronto that experienced the highest increase in population from 2001 to 2011 are:
Toronto: Waterfront Communities-The Island (133.6%), Niagara (83.4%), Bay Street Corridor (37.7%), Church-Yonge Corridor (29.6%), Mount Pleasant West (25.4%), Moss Park (24.3%), Junction Area (15.5%), Cabbagetown-South St. James Town (13.7%), Casa Loma (12.3%), University (11.4%)North York: Willowdale East (66.7%), Bayview Village (42.4%), Willowdale West (31.6%), Lansing-Westgate (24.4%), Banbury-Don Mills (16.7%), Bathurst Manor (15.2%), Newtonbrook West (12.5%), Englemount-Lawrence (10.1%)Scarborough: Rouge (59.6%), Clairlea-Birchmount (24.0%), Bendale (21.4%)Etobicoke: Islington-City Centre West (20.9%), Kingsway South (11.9%)East York: Thorncliffe Park (15.7%)It is in the neighbourhoods of Corso Italia-Davenport (-12.8%), Greenwood-Coxwell (-11.9%), Regent Park (-11.3%), and Little Portugal (-10.3%) in the old city of Toronto; and Caledonia-Fairbank (-10.4%) and Beechborough-Greenbrook (-10.0%) in York that population has declined the most.
In 2004, the United Nations Development Programme (UNDP) reported that Toronto had the second-largest proportion of foreign-born residents of major world cities, behind only Miami, Florida. However, while Miami's foreign-born population is dominated by those of Cuban and Latin American descent, Toronto's foreign-born population is not dominated by any particular ethnic or geographical group.
The 2011 National Household Survey (NHS) indicates that 49.1% of Toronto's population is composed of visible minorities; 1,264,395 non-Whites, or 20.2% of Canada's visible minority population, live in the city of Toronto; of this, approximately 70% are of Asian ancestry. Annually, almost half of all immigrants to Canada settle in the Greater Toronto Area. In March 2005, Statistics Canada projected that the combined visible minority proportion will comprise a majority in both Toronto and Vancouver by 2012, a projection which, given the 49.1% figure in the 2011 NHS, may actually prove true, at least for the case of Toronto. According to a study released by the Toronto District School Board in December 2012 found that 66 percent of students ages 4 through 18 came from visible minorities. East Asians made the largest ethnic group (33 percent) along with South Asians (28 percent) coming in second of the city of Toronto's overall population.
In particular, the progression of the percentage of visible minorities in the city of Toronto from 1996 to 2011 has been as follows:
The top visible-minority groups per Community Council (2006 Census) are as follows:
Toronto & East York (643,015): White: 66.9%, Chinese: 10.2%, South Asian: 6.3%, Black: 5.6%North York (635,260): White: 52.3%, Chinese: 13.2%, South Asian: 9.1%, Black 6.7%, Filipino: 4.6%, West Asian: 3.6%, Korean: 3.0%Scarborough (602,645): White: 32.6%, South Asian: 22.0%, Chinese: 19.5%, Black: 10.3%, Filipino: 6.5%Etobicoke York (595,420): White: 59.5%, Black: 11.4%, South Asian: 11.3%, Latin American: 4.9%While the progression of the percentage of visible minorities in the aforementioned Community Councils (pre-amalgamation municipalities or pairs thereof) has not been uniform:
Toronto & East York: 1996: 28.7% -> 2001: 32.6% (+3.9) -> 2006: 33.1% (+0.5) (Total: +4.4)North York: 1996: 39.7% -> 2001: 42.6% (+2.9) -> 2006: 47.7% (+5.1) (Total: +8.0)Scarborough: 1996: 51.9% -> 2001: 60.0% (+8.1) -> 2006: 67.4% (+7.4) (Total: +15.5)Etobicoke York: 1996: 31.1% -> 2001: 37.1% (+6.0) -> 2006: 40.5% (+3.4) (Total: +9.4)RIDINGS (2011 NHS)
The finest granularity of visible minority in Toronto provided by the 2011 NHS is that of the federal electoral district (riding; 2003 redistribution). Census tracts (and hence ward and neighbourhood) data is not available. This per-riding data (based on the 2003 redistribution) is also available for the 2001 and 2006 censuses, thus enabling useful comparisons. For instance, visible minorities as a percentage of the population only marginally increased, or even decreased (Toronto-Danforth, Parkdale-High Park, Toronto Centre, and, in the last five years, Davenport) in the "Old" Toronto, East York and South Etobicoke ridings, while on the other hand increased significantly in Scarborough and North York.
TORONTO & EAST YORK
Trinity-Spadina (140,380): 1. White (61.8%), 2. Chinese (16.0%), 3. South Asian (5.1%)Toronto Centre (125,090): 1. White (58.1%), 2. South Asian (9.0%), 3. Chinese (8.3%)St. Paul's (113,845): 1. White (73.5%), 2. Filipino (4.7%), 3. Black (4.7%)Beaches-East York (106,030): 1. White (66.4%), 2. South Asian (10.4%), 3. Chinese (5.7%)Parkdale-High Park (102,500) : 1. White (73.3%), 2. Black (4.8%), 3. South Asian (4.8%)Toronto-Danforth (102,420): 1. White (65.9%), 2. Chinese (14.1%), 3. South Asian (4.6%)Davenport (102,035): 1. White (65.9%), 2. Black (6.6%), 3. Latin American (6.6%)NORTH YORK
Willowdale (138,630): 1. White (36.0%), 2. Chinese (29.7%), 3. West Asian (9.0%)Don Valley West (122,090): 1. White (53.5%), 2. South Asian (17.0%), 3. Chinese (8.7%)York Centre (117,385): 1. White (58.8%), 2. Filipino (13.1%), 3. Black (6.7%)Eglinton-Lawrence (111,000): 1. White (70.6%), 2. Filipino (9.2%), 3. Black (6.1%)Don Valley East (110,595): 1. White (39.9%), 2. Chinese (18.0%), 3. South Asian (12.2%)York West (107,490): 1. White (27.5%), 2. Black (22.4%), 3. South Asian (16.0%)SCARBOROUGH
Scarborough-Rouge River (134,170): 1. South Asian (32.8%), 2. Chinese (30.8%), 3. Black (10.7%) [4. White (8.7%)]Scarborough-Agincourt (110,850): 1. Chinese (46.8%), 2. White (20.9%), 3. South Asian (14.4%)Scarborough Centre (110,390): 1. White (34.4%), 2. South Asian (24.2%), 3. Black (11.2%)Scarborough-Guildwood (109,805): 1. White (33.3%), 2. South Asian (30.6%), 3. Black (14.7%)Scarborough Southwest (106,590): 1. White (47.2%), 2. South Asian (18.3%), 3. Black (9.3%)ETOBICOKE & YORK
Etobicoke-Lakeshore (121,935): 1. White (75.4%), 2. South Asian (4.6%), 3. Black (4.2%)York South-Weston (114,810): 1. White (44.9%), 2. Black (21.1%), 3. Latin American (9.0%)Etobicoke Centre (111,940): 1. White (72.1%), 2. Black (7.0%), 3. South Asian (6.8%)Etobicoke North (109,835): 1. South Asian (30.6%), 2. White (26.4%), 3. Black (20.9%)Toronto CMA
Concentrations of ethnic groups per Toronto CMA municipality are as follows, with the largest proportion of each group in bold (only percentages higher than 3% are included):
Mississauga (708,725): White: 45.8%, South Asian: 21.8%, Chinese: 7.1%, Black: 6.3%, Filipino: 5.6%, Arab: 3.5%Brampton (521,315): South Asian: 38.4%, White: 32.9%, Black: 13.5%, Filipino: 3.4%Markham (300,140): Chinese: 38.3%, White: 27.5%, South Asian: 19.1%, Black: 3.2%, Filipino: 3.0%Vaughan (286,300): White: 68.4%, South Asian: 9.7%, Chinese: 4.7%Richmond Hill (184,365): White: 46.9%, Chinese: 23.6%, West Asian: 8.6%, South Asian: 8.1%Oakville (180,430): White: 76.6%, South Asian: 7.2%, Chinese: 3.5%Ajax (109,220): White: 53.2%, Black: 16.0%, South Asian: 13.8%, Filipino: 4.4%Pickering (87,920): White: 63.6%, Black: 11.4%, South Asian: 11.0%, Filipino: 3.3%Milton (83,580): White: 69.4%, South Asian: 14.0%, Filipino: 3.3%, Black: 3.3%Newmarket (78,920): White: 79.8%, South Asian: 3.7%, Chinese: 3.3%, Southeast Asian: 3.3%Caledon (58,975): White: 89.6%, South Asian: 3.4%Halton Hills (57,950): White: 93.5%Aurora (52,385): White: 81.5%, Chinese: 5.2%Georgina (42,930): White: 92.2%Whitchurch-Stouffville (37,210): White: 74.6%, South Asian: 8.0%, Chinese: 8.0%New Tecumseth (29,690): White: 95.1%Bradford West Gwillimbury (27,720): White: 88.9%East Gwillimbury (21,985): White: 93.3%Uxbridge (20,420): White: 95.0%King (19,750): White: 93.3%Top ethnic origin per Toronto neighbourhood (as designated by the City of Toronto; 2006 Census data - total responses)
English (59): Leaside-Bennington (40%), The Beaches (39%), Rosedale-Moore Park (36%), Kingsway South (35%), Lawrence Park South (33%), Yonge-Eglinton (32.4%), Guildwood (32.3%), Birchcliffe-Cliffside (31.9%), Lawrence Park North (31.5%), Yonge-St. Clair (30.8%), Cabbagetown-South St. James Town (30.1%), North Riverdale (30.0%), East End-Danforth (29.8%), Playter Estates-Danforth (29.7%), Woodbine Corridor (29%), Bridle Path-Sunnybrook-York Mills (27.3%), Centennial Scarborough (27.1%), Princess-Rosethorn (27.0%), Casa Loma (26.8%), Cliffcrest (25.7%), Markland Wood (25.7%), Woodbine-Lumsden (25.6%), Etobicoke West Mall (25.3%), Runnymede-Bloor West Village (25.3%), etc.Chinese (23): Steeles (70%), Milliken (65%), Agincourt North (56%), Agincourt South-Malvern West (47.1%), Hillcrest Village (46.9%), Kensington-Chinatown (44%), Tam O’Shanter-Sullivan (38%), L’Amoreaux (37.2%), Willowdale East (36.6%), Pleasant View (36%), Bayview Woods-Steeles (34%), South Riverdale (33%), Newtonbrook East (31%), Don Valley Village (29%), Greenwood-Coxwell (22.1%), Henry Farm (21.7%), Bay Street Corridor (21%), etc.Italian (15): Maple Leaf (45%), Humber Summit (34.5%), Pelmo Park-Humberlea (34.2%), Yorkdale-Glen Park (33.6%), Rustic (31.1%), Downsview-Roding-CFB (30.6%), Humber Heights-Westmount (20.4%), Willowridge-Martingrove-Richview (20.4%), Glenfield-Jane Heights (18%), Oakwood-Vaughan (16.8%), York University Heights (16.7%), Briar Hill-Belgravia (15%), etc.East Indian (15): West Humber-Clairville (33%), Mount Olive-Silverstone-Jamestown (30%), Thorncliffe Park (24%), Woburn (22%), Rouge (21.1%), Highland Creek (20.7%), Malvern (20.6%), Flemingdon Park (20%), Thistletown-Beaumond Heights (19.4%), Humbermede (19.1%), Crescent Town (19.0%), Morningside (16%), etc.Jewish (10): Forest Hill North (32%), Westminster-Branson (31%), Forest Hill South (29%), Bedford Park-Nortown (28%), Bathurst Manor (27%), Englemount-Lawrence (26%), Clanton Park (23%), Humewood-Cedarvale (18.2%), Lansing-Westgate (17.6%), Newtonbrook West (15%)Portuguese (9): Little Portugal (38%), Caledonia-Fairbank (37%), Weston-Pellam Park (34%), Keelesdale-Eglinton West (32%), Corso Italia-Davenport (31%), Trinity-Bellwoods (28%), Dovercourt-Wallace Emerson-Junction (27%), Dufferin Grove (25%), Rockcliffe-Smythe (15%)Filipino (3): North St. James Town (17%), Ionview (16%), Kennedy Park (13%)Jamaican (3): Beechborough-Greenbrook (15%), Black Creek (10.0%), Mount Dennis (9.7%)Canadian (2): New Toronto (21%), Alderwood (19%)Greek (1): Broadview North (15%)RIDINGS (2011 NHS)
The finest granularity of ethnic origin data provided by the 2011 NHS is that of the federal electoral district (riding; 2003 redistribution). Census tracts (and hence ward and neighbourhood) data is not available. For each of the federal electoral districts in the City of Toronto, the ethnic origin groups with 3% of more of population are shown, in a rough correspondence with community councils and pre-amalgamation municipalities (highest % for each ethnic group as well most populous ethnic group in riding as shown in bold):
TORONTO & EAST YORK
Trinity-Spadina (140,380): English 17.2%, Chinese 17.1%, Irish 14.3%, Scottish 13.6%, Canadian 12.8%, Italian 7.4%, German 7.2%, French 7.1%, Portuguese 6.5%, East Indian 4.5%, Polish 4.4%, Jewish 3.8%, British Isles (other) 3.4%, Ukrainian 3.2%Toronto Centre (125,085): English 19.8%, Irish 15.2%, Scottish 14.8%, Canadian 13.3%, Chinese 9.3%, German 7.3%, East Indian 5.2%, Filipino 5.0%, Italian 4.6%, French 4.5%, Polish 4.3%, British Isles (other) 3.3%St. Paul's (113,845): English 20.4%, Scottish 15.7%, Irish 15.6%, Canadian 14.1%, Jewish 10.4%, German 7.7%, French 7.5%, Polish 7.5%, Italian 7.0%, Russian 5.6%, Filipino 5.0%, Chinese 4.9%, Portuguese 3.5%, British Isles (other) 3.5%, Ukrainian 3.2%Beaches-East York (106,030): English 24.3%, Irish 19.7%, Scottish 18.6%, Canadian 18.3%, French 8.7%, German 8.0%, Chinese 6.8%, Italian 5.2%, East Indian 5.2%, British Isles (other) 4.0%, Greek 3.6%, Filipino 3.5%Parkdale-High Park (102,500) : English 21.8%, Irish 17.9%, Scottish 16.9%, Canadian 15.4%, German 9.0%, Polish 8.6%, French 7.6%, Ukrainian 6.3%, Italian 5.6%, Chinese 4.6%, British Isles (other) 4.0%, East Indian 3.3%, Russian 3.3%Toronto-Danforth (102,420): English 21.7%, Irish 17.3%, Scottish 16.8%, Canadian 15.7%, Chinese 15.5%, French 8.3%, Greek 7.9%, German 7.8%, Italian 5.3%, British Isles (other) 3.4%, East Indian 3.4%Davenport (102,035): Portuguese 26.4%, Italian 10.9%, English 10.3%, Canadian 10.0%, Irish 9.0%, Scottish 8.9%, Chinese 6.6%, French 4.7%, German 4.2%, Spanish 3.3%, Filipino 3.3%, East Indian 3.1%NORTH YORK
Willowdale (138,630): Chinese 30.3%, Iranian 9.9%, Korean 9.1%, English 8.4%, Canadian 6.6%, Scottish 5.4%, Irish 5.3%, Jewish 4.5%, East Indian 4.2%, Russian 4.1%, Italian 3.7%, German 3.0%Don Valley West (122,090): English 17.3%, Canadian 12.5%, Irish 12.2%, Scottish 12.1%, East Indian 10.6%, Chinese 9.7%, German 5.3%, Jewish 5.0%, French 4.7%, Filipino 4.1%, Polish 4.0%, Pakistani 4.0%, Italian 3.5%, Russian 3.4%York Centre (117,390): Italian 13.7%, Filipino 13.7%, Jewish 13.1%, Russian 10.1%, Canadian 7.7%, Polish 6.2%, English 4.7%, Chinese 4.4%, Ukrainian 4.1%, Irish 3.1%, Jamaican 3.1%Eglinton-Lawrence (111,000): Jewish 15.8%, Canadian 13.9%, English 13.7%, Scottish 10.5%, Irish 9.8%, Italian 9.4%, Filipino 9.4%, Polish 8.4%, Russian 6.7%, German 5.6%, French 4.5%, Chinese 4.1%, Portuguese 3.4%Don Valley East (110,595): Chinese 19.0%, English 10.2%, Canadian 8.8%, East Indian 8.2%, Irish 7.3%, Scottish 7.3%, Filipino 6.5%, Greek 4.0%, Italian 3.6%, French 3.6%, Iranian 3.5%, German 3.5%, Jamaican 3.2%York West (107,490): Italian 14.5%, East Indian 11.5%, Jamaican 7.9%, Vietnamese 7.4%, Canadian 6.5%, Chinese 5.7%, English 3.3%, Filipino 3.2%, Guyanese 3.2%SCARBOROUGH
Scarborough-Rouge River (134,170): Chinese 32.7%, Sri Lankan 16.8%, East Indian 15.4%, Filipino 8.6%, Canadian 6.2%, Jamaican 5.4%, English 3.9%Scarborough-Agincourt (110,855): Chinese 48.0%, East Indian 7.5%, Canadian 6.2%, English 5.6%, Sri Lankan 4.6%, Filipino 4.1%, Scottish 3.5%, Irish 3.2%Scarborough Centre (110,390): Chinese 13.1%, East Indian 11.5%, Canadian 11.2%, Filipino 11.0%, English 9.5%, Sri Lankan 7.8%, Irish 6.6%, Scottish 6.1%, Greek 4.9%, Italian 3.5%Scarborough-Guildwood (109,810): East Indian 17.8%, English 12.1%, Canadian 11.7%, Scottish 8.5%, Irish 8.4%, Filipino 7.7%, Sri Lankan 7.3%, Jamaican 6.5%, German 3.9%, Chinese 3.8%, French 3.7%, Italian 3.0%Scarborough Southwest (106,590): English 15.7%, Canadian 14.9%, Irish 12.4%, Scottish 11.8%, Filipino 9.5%, Chinese 8.0%, East Indian 7.9%, French 5.2%, German 4.9%, Italian 4.7%, Bangladeshi 3.7%, Sri Lankan 3.6%ETOBICOKE & YORK
Etobicoke-Lakeshore (121,935): English 18.2%, Canadian 15.8%, Irish 14.4%, Scottish 13.8%, Polish 10.0%, Italian 8.7%, Ukrainian 7.6%, German 6.8%, French 6.6%, Portuguese 3.6%, Chinese 3.5%, Filipino 3.4%, East Indian 3.4%York South-Weston (114,815): Italian 13.6%, Portuguese 11.5%, Canadian 8.8%, Jamaican 7.6%, English 6.7%, East Indian 5.8%, Chinese 5.1%, Vietnamese 5.0%, Scottish 4.8%, Irish 4.6%, Spanish 4.0%, Filipino 4.0%Etobicoke Centre (111,940): English 14.5%, Italian 14.2%, Canadian 12.7%, Irish 11.1%, Scottish 10.7%, Polish 7.3%, Ukrainian 7.1%, German 4.8%, East Indian 4.1%, French 3.8%, Portuguese 3.6%Etobicoke North (109,835): East Indian 23.5%, Italian 7.7%, Canadian 7.2%, Jamaican 6.6%, English 5.7%, Somali 4.0%, Filipino 3.9%, Irish 3.7%, Scottish 3.6%, Guyanese 3.2%, Pakistani 3.1%Roman Catholics accounted for 33.4% of the population of the city of Toronto in 2001, followed by Protestants with 21.2%. Members of Christian Orthodox churches accounted for 4.9%, and other Christians (those not specifically identifying as Catholic, Protestant or Orthodox) formed 3.9%. The city's religious makeup also includes Islam with 5.5% (including large number of Sunni and Ahmadiyya members), Hinduism (4.1%), Judaism (3.5%), Buddhism (2.1%), Sikh (1%), and other communities; 16.6% reported no religious affiliation.
In particular, the 2001 Census data showed the following data per pre-amalgamation municipality:
Toronto (667,320) : Catholic 31.1%, No religious affiliation 26.2%, Protestant 20.8%, Jewish 5.0%, Muslim 4.0%, Christian Orthodox 3.7%, Buddhist 3.4%North York (603,060) : Catholic 30.2%, Protestant 18.0%, No religious affiliation 15.8%, Jewish 10.1%, Muslim 7.8%, Christian Orthodox 5.2%, Christian, not included elsewhere 4.6%, Hindu 4.1%Scarborough (588,675) : Catholic 26.2%, Protestant 22.8%, No religious affiliation 19.7%, Hindu 9.7%, Muslim 7.8%, Christian Orthodox 5.1%, Christian, not included elsewhere 4.7%,Etobicoke (334,570) : Catholic 39.6%, Protestant 24.6%, No religious affiliation 11.3%, Muslim 6.9%, Hindu 4.9%, Christian Orthodox 4.3%, Christian, not included elsewhere 3.5%, Sikh 3.3%York (148,940) : Catholic 45.6%, Protestant 18.8%, No religious affiliation 12.8%, Muslim 5.0%, Christian, not included elsewhere 4.4%, Christian Orthodox 3.9%, Jewish 3.7%East York (114,245) : Protestant 25.3%, Catholic 23.6%, No religious affiliation 17.1%, Muslim 12.5%, Christian Orthodox 12.0%, Hindu 3.7%The 2011 National Household Survey found that Roman Catholics accounted for 28.2% of the population in the city of Toronto in 2011, followed by those of no religious affiliation at 24.1%, "Other Christian" at 9.7%, and Muslims at 8.2%. Besides those registered in the "other Christian" category there were other Christian denominations who were also registered in the census, including Anglicans(3.8%), Baptists (1.4%), Christian Orthodox (4.3%), Lutheran (0.6%), Pentecostal (1.6%), Presbyterian (1.5%), and United Church (3%). Buddhists (2.7%), Hindu (5.6%), Judaism(3.8%), Sikh (0.8%), Aboriginal spirituality (0.03%) and "Other religions" (0.5%) were also included.
While English is the predominant language spoken by Torontonians, Statistics Canada reports that other language groups are significant, of which most prevalent are:
The Indo-Iranian languages (554,855 native speakers, most of which having Panjabi (Punjabi), Urdu, or Persian as their mother tongue)The Romance languages (531,270 native speakers; most notably the Italian, Spanish, and Portuguese language, as well as French, Canada's other official language)Chinese (455,200 native speakers; the predominant varieties are Cantonese and Mandarin)The Slavic languages (268,905 native speakers total), of which Russian and Polish are most prominentThe finest granularity of mother tongue and language spoken in Toronto yet provided by the 2011 Census is that of the federal electoral district (riding; 2003 redistribution). Census tracts (and hence ward and neighbourhood) data is not yet available. For each of the federal electoral districts in the City of Toronto, the top three (3) (or more if having more than 3% of native speakers; single responses are used - it is indicated by way of using bold whether English is the mother tongue of more than 60% of the population or if another language exceeds 10% of native speakers) are as follows:
TORONTO & EAST YORK
Trinity-Spadina (137,865): 1. English (60.2%), 2. Cantonese (4.7%), 3. Portuguese (4.5%), 4. Chinese, not otherwise specified (4.5%), 5. Mandarin (3.8%)Toronto Centre (123,430): 1. English (61.7%), 2. Spanish (2.5%), 3. Chinese, not otherwise specified (2.4%)St. Paul's (112,470): 1. English (69.4%), 2. Spanish (3.0%), 3. Tagalog (Pilipino, Filipino) (2.6%)Beaches-East York (103,625): 1. English (70.0%), 2. Bengali (3.7%), 3. Greek (2.0%)Parkdale-High Park (100,595) : 1. English (63.0%), 2. Polish (4.3%), 3. Spanish (2.3%)Toronto-Danforth (100,420): 1. English (63.7%), 2. Cantonese (5.8%), 3. Greek (5.0%), 4. Chinese, not otherwise specified (3.6%)Davenport (98,425): 1. English (47.5%), 2. Portuguese (21.4%), 3. Italian (5.9%), 4. Spanish (5.6%)NORTH YORK
Willowdale (135,455): 1. English (35.1%), 2. Chinese, not otherwise specified (9.4%), 3. Persian (9.3%), 4. Korean (7.9%), 5. Mandarin (7.7%)Don Valley West (118,545): 1. English (54.4%), 2. Urdu (5.9%), 3. Persian (4.0%)York Centre (112,950): 1. English (40.5%), 2. Russian (11.9%), 3. Italian (7.6%), 4. Tagalog (Pilipino, Filipino) (7.4%) 5. Spanish (5.0%)Eglinton-Lawrence (108,730): 1. English (63.1%), 2. Tagalog (Pilipino, Filipino) (5.3%), 3. Italian (4.9%)Don Valley East (106,115): 1. English (42.1%), 2. Mandarin (6.5%), 3. Chinese, not otherwise specified (6.1%) 4. Persian (4.6%), 5. Arabic (3.5%), 6. Tagalog (Pilipino, Filipino) (3.2%), 7. Cantonese (3.2%)York West (103,395): 1. English (44.0%), 2. Italian (9.6%), 3. Spanish (8.5%), 4. Vietnamese (5.3%), 5. Urdu (3.0%)SCARBOROUGH
Scarborough-Rouge River (128,905): 1. English (37.4%), 2. Tamil (13.8%), 3. Cantonese (13.1%), 4. Mandarin (4.6%), 5. Tagalog (Pilipino, Filipino) (4.3%), 6. Urdu (3.2%)Scarborough-Agincourt (107,465): 1. English (30.2%), 2. Chinese, not otherwise specified (15.8%), 3. Cantonese (14.4%), 4. Mandarin (12.0%), 5. Tamil (5.0%)Scarborough-Guildwood (105,900): 1. English (57.6%), 2. Tamil (8.0%), 3. Gujarati (6.0%), 4 Tagalog (Pilipino, Filipino) (3.9%), 5. Urdu (3.2%)Scarborough Centre (105,880): 1. English (47.7%), 2. Tamil (8.5%), 3. Tagalog (Pilipino, Filipino) (6.1%) 4. Chinese, not otherwise specified (3.8%), 5. Cantonese (3.5%)Scarborough Southwest (103,270): 1. English (59.3%), 2. Bengali (6.1%), 3. Tagalog (Pilipino, Filipino) (5.0%), 4. Tamil (3.4%)ETOBICOKE YORK
Etobicoke-Lakeshore (119,120): 1. English (59.7%), 2. Polish (5.6%), 3. Ukrainian (3.5%)York South-Weston (111,710): 1. English (49.9%), 2. Portuguese (9.0%), 3. Spanish (8.2%), 4. Italian (7.6%), 5. Vietnamese (3.6%)Etobicoke Centre (109,250): 1. English (54.1%), 2. Italian (5.5%), 3. Ukrainian (4.1%), 4. Spanish (3.2%)Etobicoke North (105,620): 1. English (45.4%), 2. Panjabi (Punjabi) (10.1%), 3. Gujarati (4.8%), 4. Italian (3.8%), 5. Urdu (3.1%), 6. Somali (3.0%)Following are the corresponding data for the GTA ridings neighbouring the City of Toronto:
IN YORK REGION
Oak Ridges-Markham (220,005): 1. English (52.2%), 2. Cantonese (10.9%), 3. Chinese, not otherwise specified (6.6%), 4. Italian (3.5%), 5. Mandarin (3.2%)Vaughan (187,340): 1. English (47.5%), 2. Italian (20.0%), 3. Spanish (3.1%)Thornhill (136,120): 1. English (47.6%), 2. Russian (10.9%), 3. Cantonese (4.5%), 4. Persian (4.1%) 5. Chinese, not otherwise specified (3.9%), 6. Korean (3.2%) 7. Hebrew (3.1%)Markham-Unionville (131,250): 1. English (34.2%), 2. Cantonese (18.1%), 3. Chinese, not otherwise specified (12.7%), 4. Tamil (7.5%), 5. Mandarin (6.0%), 6. Urdu (3.2%)Newmarket-Aurora (129,460): 1. English (77.4%), 2. Italian (2.1%), 3. Russian (1.7%)Richmond Hill (124,865): 1. English (40.4%), 2. Cantonese (10.1%), 3. Persian (9.2%), 4. Russian (7.8%), 5. Mandarin (5.7%), 6. Italian (5.7%), 7. Korean (3.4%)IN PEEL REGION
Bramalea-Gore-Malton (182,545): 1. English (49.3%), 2. Panjabi (Punjabi) (22.2%), 3. Urdu (3.0%)Mississauga-Brampton South (138,495): 1. English (41.6%), 2. Panjabi (Punjabi) (8.0%), 3. Urdu (5.2%), 4. Polish (3.8%), 5. Tagalog (Pilipino, Filipino) (3.5%)Mississauga East-Cooksville (131,915): 1. English (40.0%), 2. Polish (6.7%), 3. Urdu (5.0%), 4. Arabic (4.8%), 5. Tagalog (Pilipino, Filipino) (4.1%), 6. Spanish (3.2%)Mississauga South (108,685): 1. English (66.0%), 2. Polish (4.9%), 3. Portuguese (2.4%)IN DURHAM REGION
Ajax-Pickering (133,135): 1. English (78.2%), 2. Urdu (2.3%), 3. Tagalog (Pilipino, Filipino) (2.1%)Pickering-Scarborough East (104,495): 1. English (76.6%), 2. Tamil (2.4%), 3. Tagalog (Pilipino, Filipino) (2.4%)According to the Canadian government, Toronto has the highest per capita immigration rate in the world. Within Canada itself, 43% of all new immigrants to Canada settle in the Greater Toronto Area adding significantly to Toronto's population. According to the 2006 Census, 45.7% of the residents of Toronto were immigrants. For the City of Toronto, the corresponding figure stood at 50.0%
The 2006 Census data show the following temporal patterns in the sources of immigration to Toronto (and retention of immigrants per source country):
Recent immigrants (2001-2006, 447,930): India 17.4%, China 14.3%, Pakistan 8.3%, Philippines 7.4%, Sri Lanka 3.9%, Iran 3.2%Period of immigration: 1996-2000 (362,320): India 13.5%, China 13.1%, Pakistan 7.8%, Philippines 5.9%, Sri Lanka 5.2%, Hong Kong 4.3%, Iran 3.4%, Russia 3.2%Period of immigration: 1991-1995 (357,865): Hong Kong 9.1%, India 8.7%, Philippines 8.7%, Sri Lanka 8.3%, China 8.1%, Poland 4.5%, Jamaica 4.1%, Guyana 3.5%, Vietnam 3.3%Period of immigration: Before 1991 (1,152,050): Italy 11.1%, United Kingdom 9.7%, Portugal 5.9%, India 5.6%, Jamaica 5.5%, Hong Kong 4.5%, China 4.4%, Philippines 3.9%, Poland 3.8%, Guyana 3.8%, Vietnam 3.4%The percentage and breakdown of immigrants per place of birth for each City of Toronto Community Council is as follows:
Toronto & East York (642,940): 39.0% (Eastern Asia 6.7%; Southern Europe 6.5%; Southeast Asia 4.1%; Southern Asia 3.7%; Eastern Europe 3.3%; Northern Europe 3.2%)North York (635,265): 54.4% (Eastern Asia 11.3%; Eastern Europe 6.5%; West Central Asia & Middle East 6.1%; Southern Europe 6.0%; Southeast Asia 5.5%; Southern Asia 5.5%)Scarborough (602,610): 57.4% (Eastern Asia 14.3%; Southern Asia 13.9%; Southeast Asia 6.6%; Caribbean & Bermuda 5.1%; South America 3.4%; Southern Europe 3.2%)Etobicoke York (595,370): 49.6% (Southern Europe 11.4%; Southern Asia 7.0%; Eastern Europe 5.8%; Caribbean & Bermuda 4.6%; Southeast Asia 4.2%; South America 4.1%)The City of Toronto ward with the highest percentage of total immigrants is Ward 41 Scarborough-Rouge River where 71.4% of the total population are immigrants (Eastern Asia 41.4%, Southern Asia 10.7%, Southeast Asia 6.0%, Caribbean & Bermuda 3.8%). At the other end of the spectrum is Ward 16 Eglinton-Lawrence having the lowest percentage of immigrants, 24.7% in particular (Eastern Europe 4.1%, Northern Europe 3.4%, Southern Europe 3.3%).
Largest area (hectares): Ward 42 - Scarborough-Rouge River: 3,928Smallest area (hectares): Ward 18 - Davenport: 474Most populous: Ward 23 - Willowdale: 79,435Least populous: Ward 19 - Toronto-Danforth: 44,420Highest % recent immigrants: Ward 33 - Don Valley East: 24.1%Lowest % recent immigrants: Ward 16 - Eglinton Lawrence: 3.7%Highest % visible minorities: Ward 42 - Scarborough-Rouge River: 88.7%Lowest % visible minorities: Ward 16 - Eglinton Lawrence: 12.6%Highest median household income: Ward 25 - Don Valley West: $86,901Lowest median household income: Ward 14 - Parkdale-High Park: $38,352Mother tongue
(highest %)
English: Ward 32 - Beaches-East York: 77.7% (Lowest %: Ward 39 - Scarborough-Agincourt: 24.9%)Portuguese: Ward 18 - Davenport: 25.3%Cantonese: Ward 41 - Scarborough-Rouge River: 23.5%Chinese, not otherwise specified: Ward 39 - Scarborough-Agincourt: 22.2%Italian: Ward 9 - York Centre: 20.4%Russian: Ward 10 - York Centre: 19.5%Tamil: Ward 42 - Scarborough-Rouge River: 15.1%Panjabi (Punjabi): Ward 1 - Etobicoke North: 13.3%Urdu: Ward 26 - Don Valley West: 11.2%Greek: Ward 29 - Toronto-Danforth: 10.7%Home language
(highest %)
English: Ward 16 - Eglinton-Lawrence: 89.9% (Lowest %: Ward 39 - Scarborough-Agincourt: 36.1%)Cantonese: Ward 41 - Scarborough-Rouge River: 22.5%Chinese, not otherwise specified: Ward 39 - Scarborough-Agincourt: 18.3%Portuguese: Ward 18 - Davenport: 17.8%Russian: Ward 10 - York Centre: 17.6%Italian: Ward 9 - York Centre: 12.7%Tamil: Ward 42 - Scarborough-Rouge River: 12.7%Panjabi (Punjabi): Ward 1 - Etobicoke North: 11.0%Ethnic origin
(highest %; single responses)
Chinese: Ward 41 - Scarborough-Rouge River: 56.1%Portuguese: Ward 17 - Davenport: 28.0%Italian: Ward 9 - York Centre: 27.2%East Indian: Ward 1 - Etobicoke North: 26.0%Jewish: Ward 10 - York Centre: 17.3%Greek: Ward 29 - Toronto-Danforth: 13.0%Visible minority
(highest %)
Not a visible minority: Ward 16 - Eglinton-Lawrence: 87.4%Chinese: Ward 41 - Scarborough-Rouge River: 57.3%South Asian: Ward 1 - Etobicoke North: 37.9%Black: Ward 8 - York West: 21.8%Filipino: Ward 25 - Scarborough Southwest: 10.4%Latin American: Ward 7 - York West: 9.6%Korean: Ward 23 - Willowdale: 9.4%Southeast Asian: Ward 8 - York West: 7.2%West Asian: Ward 23 - Willowdale: 6.9%Arab: Ward 34 - Don Valley East: 3.0%Japanese: Ward 27 - Toronto Centre-Rosedale: 1.2%(highest %)
Earned doctorate: Ward 20 - Trinity-Spadina: 3.3%Master's degree: Ward 27 - Toronto Centre-Rosedale: 13.0%Degree in medicine, dentistry, veterinary medicine: Ward 25 - Don Valley West: 3.5%University certificate above bachelor level: Ward 22 - St. Paul's: 5.5%Bachelor's degree: Ward 22 - St. Paul's: 31.5%University certificate or degree: Ward 22 - St. Paul's: 54.1%