
 | ||
In 2011, the population of the city of Ottawa was 883,391, an 8.8% increase from 2006. The population of the census metropolitan area was 1,215,735.
Contents
Age and sex
In 2001, females made up 51.2% of the amalgamated Ottawa population, while the median age of the population was 36.7 years of age. Youths under 15 years of age comprised 18.9% of the total population, while those of retirement age (65 years and older) comprised 11.4%.
Migration and immigration
Between 1987 and 2002, 131,816 individuals relocated to the city, which represents 75% of the population growth for that period. Foreign immigration plays a significant role in Ottawa's population growth. Foreign born residents make up 23.4 percent of Ottawa's population, in which many come from the United Kingdom, China, India, the United States, Lebanon, Pakistan, Somalia, Iran, the Philippines, Vietnam, and Haiti.
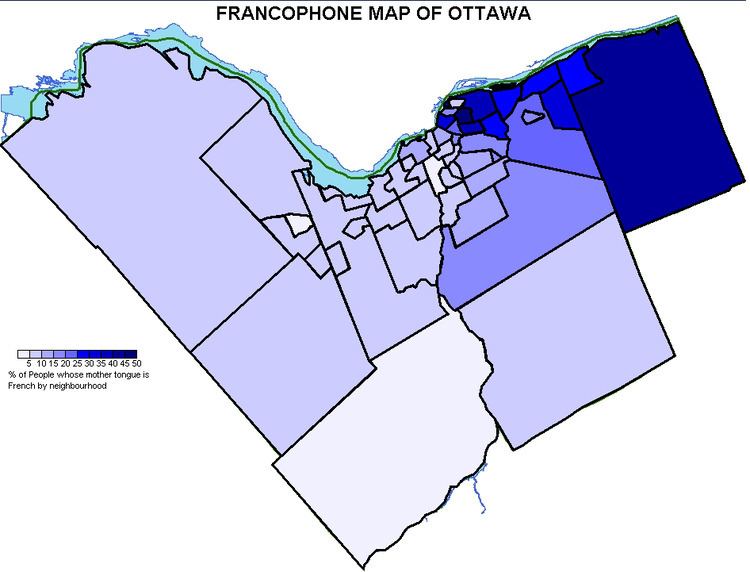
Languages
Bilingualism in Ottawa became official policy in 2002, making all municipal services available in both of Canada's official languages (Canadian English and Canadian French). Nearly 300,000 people, or 37% of Ottawa's population, can speak both languages, As such it is the largest city in Canada with both English and French as co-official languages. Those who identify their mother tongue as English constitute 62.4 percent, while those with French as their mother tongue make up 14.2 percent of the population. In terms of respondents' knowledge of one or both official languages, 59.9 percent and 1.5 percent of the population have knowledge of English only and French only, respectively; while 37.2 percent have knowledge of both official languages. An additional 20.4 percent list languages other than English and French as their mother tongue. These include Arabic (3.2%), Chinese (3.0%), Spanish (1.2%), Italian (1.1%), and many others.
The Algonquian languages have been spoken for centuries by the Indigenous peoples and subsequently by the French coureurs des bois and voyageurs of the Ottawa valley during the 1600s and 1700s. Starting in the mid-1800s, Irish settlers of the Ottawa valley develop a distinct dialect referred to as "Ottawa Valley Twang". Traces of "Valley Twang" although rare, can still be heard in the valley's more isolated areas.
Ethnicities, visible minorities and Aboriginals
Members of visible minority groups (non-white/European) constitute 23.7 percent, while those of Aboriginal origin make up 2.1% of the total population. The largest visible minority groups are: Black Canadians: 5.7%, Chinese Canadians: 4.0%, South Asians: 3.9%, and Arabs: 3.7%. Smaller groups include Southeast Asians, Filipinos, Latin Americans, and West Asians.
Religion
In the 2011 Canadian census, 65.4 percent of the population belonged to Christian denominations, the most common being Roman Catholicism at 38.4%. Non-Christian religions are also very well established in Ottawa, the largest being Islam: 6.7%, Hinduism: 1.4%, Buddhism: 1.3%, and Judaism: 1.2%. Approximately one percent of people living in Ottawa, or 8740 persons in 2011, comprised the Statistics Canada category "Other Religions". The largest three groups in rank order are Sikhs (3420), Unitarians (1165) and Baha'is (950), followed by Pagan and Wiccan. These five groups together comprise nearly three quarters of the total number of members of Other Religions. Those with no religious affiliation represent 21.8%, of which approximately 4.8% are atheist, agnostic and humanist. Others who listed a religion or no religious affiliation may also be part of this group.