
 | ||
The demographics of Asian Americans describe a heterogeneous group of people in the United States who trace their ancestry to one or more Asian countries. Because Asian Americans total about 5.6% of the entire US population, diversity within the group is often overlooked in media treatment.
Contents
Background
The first recorded Asian Americans in the continental United States were a group of Filipino men who established the small settlement of Saint Malo, Louisiana, after fleeing mistreatment aboard Spanish ships. Since there were no women with them, the Manilamen, as they were known, married Cajun and Native American women. In 1778, Chinese and European explorers first arrived in Hawaii. Numerous Chinese and Japanese began immigrating to the US in the mid-19th century; numerous Chinese immigrants worked as laborers on the First Transcontinental Railroad, many who immigrated due to overpopulation and poverty experienced in Canton Province. In the mid-20th century, refugees from Southeast Asia fled wars in the homelands to come to the United States. Most Asian Americans who immigrated to the United States arrived after 1965, due to immigration reform that ended an earlier era of exclusion of Asian immigrants.
Population
According to the United States Census Bureau, the Asian American population, including those of multiracial and Hispanic and Latino ancestry, had increased to 18,205,898 by 2011.
During the 2010 United States Census, there were a total of 17,320,856 Asian Americans, including Multiracial Americans identifying as part Asian. This made Asian Americans 5.6 percent of the total American population. The largest ethnic groups represented in the census were Chinese (3.79 million), Filipino (3.41 million), Indian (3.18 million), Vietnamese (1.73 million), Korean (1.7 million), and Japanese (1.3 million). Other sizable ethnic groups include Pakistani (409,000), Cambodian (276,000), Hmong (260,000), Thai (237,000), Laotian (232,000), Taiwanese (230,000), Bangladeshi (147,000), and Burmese (100,000). The total population of Asian Americans grew by 46 percent from 2000 to 2010 according to the Census Bureau, which constituted the largest increase of any major racial group during that period. In 2010, there were an estimated 11,284,000 foreign born individuals who were born in Asia, of whom 57.7% had become naturalized citizens. Additionally, 209,128 were Hispanic and Latino, of whom the largest population (101,654) claim Mexico as their nation of origin.
The 2000 census recorded 11.9 million people (4.2 percent of the total population) who reported themselves as having either full or partial Asian heritage. The largest ethnic subgroups were Chinese (2.7 million), Filipino (2.4 million), Indian (1.9 million), Vietnamese (1.2 million), Korean (1.2 million), and Japanese (1.1 million). Other sizable groups included Cambodians (206,000), Pakistanis (204,000), Lao (198,000), Hmong (186,000), and Thais (150,000). About one-half of the Asian American population lived in the West, with California having the most total Asian Americans of any state, at 4.2 million. As a proportion of the total population, Hawaii is the only state with an Asian American majority population, at 58 percent; Honolulu County had the highest percentage of Asian Americans of any county in the nation, with 62 percent. In 2000, 69 percent of all Asian Americans were foreign born, although Japanese Americans, 60 percent of whom were born in the United States, bucked this trend.
The Twenty-first United States Census, conducted in 1990, recorded 6.9 million people who were called American Asians. The largest ethnic groups were Chinese (23.8 percent), Filipino (20.4 percent), Japanese (12.3 percent), Indian (11.8 percent), Korean (11.6 percent), Vietnamese (8.9 percent), and Laotian (2.2 percent). Smaller populations, of less than two percent, were documented of the following ethnicities: Cambodian, Thai, Hmong, Pakistani, Indonesian, Malay, Bangladeshi, Sri Lankan, and Burmese. Two thirds of "American Asians" lived in the five states of California, New York, Hawaii, Texas, and Illinois; additionally their highest population concentrations were in California, New York, and Hawaii. In 1990, 66 percent of American Asians were foreign born, with Vietnamese, Laotians, and Cambodians having this highest foreign born populations.
Trends
Asian Americans, on average, have higher incomes and education levels than White Americans. However, they also have higher poverty rates and lower home ownership rates. In addition, homeownership among Asian Americans has increased by twice as much as white Americans in recent years (see Homeownership in the United States). Since the majority of the Asian American population is urbanized it usually offers more access to an educational environment as well as academic supplies. With that being said, Asian Americans will tend to find better access to higher paying jobs because of their better access to resources. Also, rural settings require farm hands which will prevent children and teenagers from completing highschool and graduating with a diploma. Their daily tasks may include packaging, cultivating, harvesting, and watering. For rural families, helping out with the family business may be a more immediate concern that education.
Education
Asian Americans have the highest educational attainment of any racial group in the country; about 49.8% of them have at least a bachelor's degree. Since the 1990s, Asian American students often have the highest math averages in standardized tests such as the SAT and GRE. Their verbal scores generally lag, but their combined scores are usually higher than those of white Americans. The proportion of Asian Americans at many selective educational institutions far exceeds the national population rate. Asians constitute around 10–20 percent of those attending Ivy League and other elite universities. Asian Americans are the largest racial group on seven of the nine University of California campuses, are the largest racial group of undergraduates in the system, and make up more than a quarter of graduate and professional students. Asian Americans are more likely to attend college, are more likely to apply to competitive colleges, and have significantly higher college completion level than other races. According to a poll targeting Asian Americans in 14 states and the District of Columbia conducted by the Asian American Legal Defense and Education Fund in 2013, 40 percent of Asian Americans have a college degree, with almost a quarter of them having achieved an education attainment greater than a bachelor's degree. That same year, Asian Americans in their late thirties had the highest percentage (65%) of college graduates for that age group than any other race or ethnicity in the United States.
However, there are concerns that the goal of diversity in American higher education has had a negative effect on Asians, with charges of quotas and discrimination starting in the 1980s. Asian American test scores are also bimodal—Asians are overrepresented both at high scores and low scores.
Population growth
Asian American population growth is fueled largely by immigration. Natural population growth accounts for a small proportion of the 43 percent increase in total Asian American population between 2000 and 2010.
Language
In 2010, there were 2.8 million people (5 and older) who spoke a Chinese language at home; after the Spanish language, it is the third most common language in the United States. Other sizeable Asian languages are Tagalog, Vietnamese, and Korean, with all three having more than 1 million speakers in the United States. In 2012, Alaska, California, Hawaii, Illinois, Massachusetts, Michigan, Nevada, New Jersey, New York, Texas and Washington were publishing election material in Asian languages in accordance with the Voting Rights Act; these languages include Tagalog, Mandarin Chinese, Vietnamese, Hindi and Bengali. Election materials were also available in Gujarati, Japanese, Khmer, Korean, and Thai. According to a poll conducted by the Asian American Legal Defense and Education Fund in 2013, it found that 48 percent of Asian Americans considered media in their native language as their primary news source.
According to the 2000 Census, the more prominent languages of the Asian American community include the Chinese languages (Cantonese, Taishanese, and Hokkien), Tagalog, Vietnamese, Korean, Japanese, Hindi, Urdu, and Gujarati. In 2008, Chinese, Japanese, Korean, Tagalog, and Vietnamese languages are all used in elections in Alaska, California, Hawaii, Illinois, New York, Texas, and Washington state.
Religion
Asian Americans' religious preferences are wide-ranging, and tends to be more diverse than among other races in the United States. The growth of Asian American immigration since 1965 has contributed to this diversity. Until recently, a dearth of scholarship regarding Asian American religious beliefs led to a stereotype that Asian Americans are not religious or spiritual. Although 59 percent of Asian Americans believe strongly in the existence of one or more gods exist, 30 percent identify as "secular" or "somewhat secular." Only 39 percent of Asian American households belong to a local church or temple, due to atheism or adherence to Eastern religions without congregational traditions.
Although no one religious affiliation claims a majority of Asian Americans, about 45 percent of them adhere to some form of Christianity. A Trinity College survey, conducted in 2008, found that 38 percent of Christian Asian Americans are Catholic; Filipino Americans are majority Catholic, and a significant minority of Vietnamese Americans are as well. The Trinity survey also found that of all demographic populations, Asian Americans had the highest number of respondents who did not claim a religion or refused to divulge their religious affiliation. Various surveys have put this number between 23 and 27 percent of Asian Americans. Additionally, the Trinity College survey found that 8% of Asian Americans are Muslim; many of these Muslim Asian Americans come from, or trace their ancestry to, Bangladesh, China, India, Indonesia, Malaysia, and Pakistan.
A Gallup poll conducted in 2010 found that Asian Americans were the group least likely to say that religion was important in their daily lives, although a 54 percent majority of respondents still said that religion was important in their daily lives. In 2012, a survey was conducted by the Pew Research Center of the Faiths of Asian Americans, it found that Christianity had the largest plurality (42%) of Asian American respondents, followed by those who were unaffiliated (26%). The three next largest faiths, of those who responded, were Buddhist (14%), Hindu (10%), and Muslim (4%).
Sexuality
According to a Gallup survey conducted from June to September 2012, 4.3 percent of Asian Americans self identify as LGBT. This compares with 3.4 percent of African-Americans, 4 percent of Hispanic-Americans, 4.6 percent of Caucasian-Americans, and the overall 3.4 percent of American adults that self identify as LGBT in the total population.
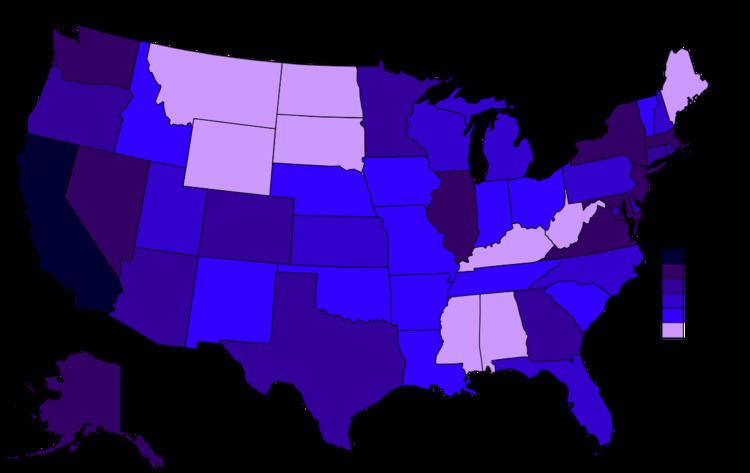
US States by Asian American population
The above list displays the population of Asian Americans ("Alone, or in combination") in US states, Puerto Rico, and the District of Columbia, according to the 2010 United States Census; Data for American Samoa, Guam, Northern Mariana Islands, and the Virgin Islands have not yet been released.
Chinese Americans figures include Taiwanese Americans