
 | ||
CrimeStat is a crime mapping software program. CrimeStat is Windows-based program that conducts spatial and statistical analysis and is designed to interface with a geographic information system (GIS). The program is developed by Ned Levine & Associates, with funding by the National Institute of Justice (NIJ), an agency of the United States Department of Justice. The program and manual are distributed for free by NIJ.
Contents
- Development
- Data setup
- Statistical routines
- Output
- Shortcomings
- Ancillary CrimeStat development
- Reviews and examples
- Use of CrimeStat by Baltimore County Police analysts
- References
CrimeStat performs spatial analysis on objects located in a GIS. The objects can be points (e.g., events, locations), zones (e.g., blocks, traffic analysis zones, cities) or lines (e.g., street segments). The program can analyze the distribution of the objects, identify hot spots, indicate spatial autocorrelation, monitor the interaction of events in space and time, and model travel behavior.
There is a regression module for non-linear spatial modeling. Some of its tools are specific to crime analysis. Others can by applied in many fields. There are 55 statistical routines in the program.
Development
CrimeStat has been developed since the mid-1990s. The first prototype was a Unix-based C++ program called Pointstat that was developed to analyze motor vehicle crashes in Honolulu. In 1996, the National Institute of Justice funded the first version of CrimeStat and the early Pointstat routines were folded into the program.
The first version (1.0) was released in August 1999: the latest version is 3.3 (July 2010).
Data setup
CrimeStat can input data both attribute and GIS files but requires that all datasets have geographical coordinates assigned for the objects. The basic file format is dBase (dbf) but shape (shp), and Ascii text files can also be read. The program requires a Primary File but many routines also use a Secondary File. CrimeStat uses three coordinate systems: spherical (longitude, latitude), projected and directional (angles).
Distance can be measured as direct, indirect (Manhattan) or on a network (which also allows travel time or speed to be used). Distance units are decimal degrees for spherical coordinates and feet, meters, miles, kilometers, or nautical miles for projected coordinates. The program can create reference grids. Several routines also use the area of the geographical region for their calculations.
Statistical routines
The spatial description routines include:
Monte Carlo simulations can be run on many routines to estimate credible intervals.
The spatial modeling routines include:
- Single kernel density interpolation for examining variation over a region of a single variable
- Dual kernel density interpolation of two variables (e.g., a set of events in relation to a population ‘at risk’)
- Head Bang routine for smoothing zonal data
- ”Interpolated Head Bang surface that interpolates the Head Bang estimates to a grid
- ”Knox and Mantel indexes that identify the interaction between space and time in events
- Correlated Walk Analysis, based on random walk theory, for modeling the sequential behavior of a serial offender in space and time and makes a prediction about the next event
- Journey-to-crime analysis for modeling the likely origin of a serial offender based on the location of prior events committed by the offender (geographic profiling)
- Bayesian Journey-to-crime which is an empirical Bayes method that integrates the Journey-to-crime estimate with information on the residence location of other serial offenders who committed crimes in the same places to produce an updated estimate. The diagnostic routine compares this estimate with its components in predicting the residence location for multiple serial offenders
- Bayesian Journey-to-crime estimation which applies the Bayesian Journey-to-crime method to estimate the location of one serial offender
- Spatial regression. The models include ordinary least squares, Poisson regression and various other generalized linear models for count data. In addition there are Markov chain Monte Carlo routines for fitting Poisson-Gamma models, including where these have a conditional spatial autoregression (CAR) adjustment.
The Crime Travel Demand module models crime travel over a metropolitan area. It is an application of travel demand modeling to crime or other rare events. The purpose is to calibrate the travel behavior of a large number of offenders in committing crimes as a basis for modeling alternative interventions by law enforcement
Output
CrimeStat has three different types of output:
Shortcomings
Unlike some other spatial statistics programs, CrimeStat has no mapping capabilities and must be used with GIS software. Some users have found that the GUI interface is difficult to understand and inconsistent between routines.
Because CrimeStat analyzes points in most routines, its results are not always consistent with those of software that analyzes areas (e.g. GeoDa). Finally, the size of the manual may be daunting to new users of spatial statistics.
Ancillary CrimeStat development
In addition to the development of the CrimeStat program, all the routines through version 2.0 plus the spatial autocorrelation routines have been converted into .NET libraries for use in third-party applications. Version 1.0 of the CrimeStat Libraries was released in August 2010 and is available on the CrimeStat web page.
Reviews and examples
Reviews and examples of CrimeStat in its application to crime analysis have been published. Examples of the use of CrimeStat outside of crime analysis have also apperared.
Use of CrimeStat by Baltimore County Police analysts
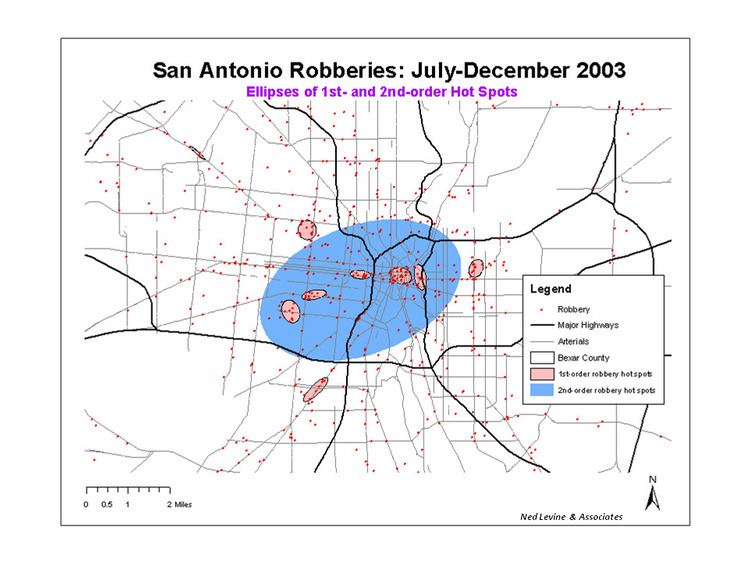
Baltimore County Police analysts use CrimeStat to perform various spatial analytics. The primary responsibility of police analysts in Baltimore County is to identify and address existing or anticipated crime problems. Police analysts use “hot spot analysis” in CrimeStat to identify areas within the county having high concentrations of crime. Another example demonstrating the use of CrimeStat involves the department’s Data Driven Approaches to Crime and Traffic Safety (DDACTS).
Police analysts used Nearest Neighbor Hierarchical Spatial clustering to identify areas having high concentrations of crime and traffic accidents. Analysts found that the two cluster groups, crime and accidents, did tend to overlap in many areas of the county. The County’s DDACTS program was initiated to increase police presence in the target areas. Preliminary results have been encouraging, with most targeted crimes and traffic accidents dropping in DDACTS areas.
The Department’s DDACTS program has since become a model nationwide with the support of the National Highway Traffic Safety Administration. Finally, police analysts have used CrimeStat’s Journey to Crime and Bayesian Journey to Crime Estimation models to successfully identify a serial offender’s activity space. Once an offender’s activity space has been identified, police analysts will examine information captured from other police sources such as traffic stops, Field Interview Reports, and License Plate Readers to determine if a contact was made with a potential offender.
Police have also used CrimeStat’s Crime Travel Demand model to identify road networks used by drivers under the influence (DUI). Roadways identified by the Crime Travel Demand model were targeted for interdiction programs by the department’s DUI Enforcement Team. Similar weighted road networks have been used in conjunction with Journey to Crime models to improve identification of an offender’s activity space.