
 | ||
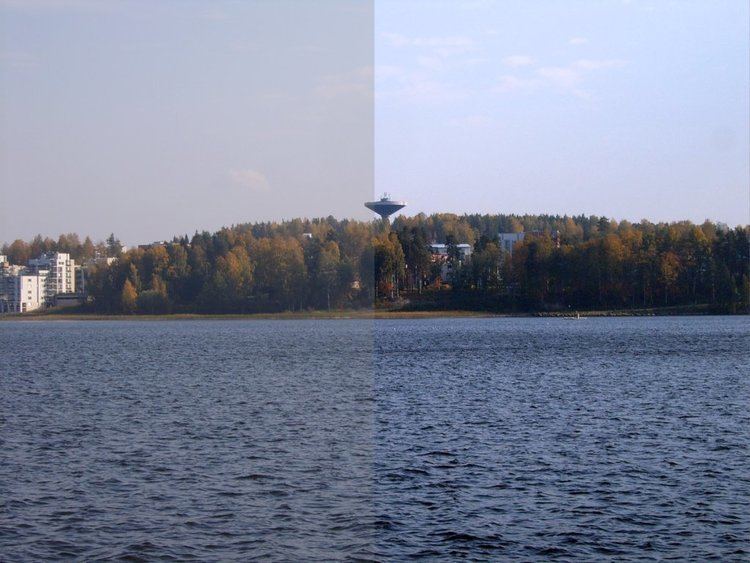
Contrast is the difference in luminance or colour that makes an object (or its representation in an image or display) distinguishable. In visual perception of the real world, contrast is determined by the difference in the color and brightness of the object and other objects within the same field of view. The human visual system is more sensitive to contrast than absolute luminance, we can perceive the world similarly regardless of the huge changes in illumination over the day or from place to place. The maximum contrast of an image is the contrast ratio or dynamic range.
Contents
Biological contrast sensitivity
The human contrast sensitivity function shows a typical band-pass filter shape peaking at around 4 cycles per degree with sensitivity dropping off either side of the peak. This tells us that the human visual system is most sensitive in detecting contrast differences occurring at 4 cycles per degree; i.e., at this spatial frequency humans can detect lower contrast differences than at any other angular frequency.
The high-frequency cut-off represents the optical limitations of the visual system's ability to resolve detail and is typically about 60 cycles per degree. The high-frequency cut-off is related to the packing density of the retinal photoreceptor cells: a finer matrix can resolve finer gratings.
The low frequency drop-off is due to lateral inhibition within the retinal ganglion cells. A typical retinal ganglion cell presents a centre region with either excitation or inhibition and a surround region with the opposite sign. By using coarse gratings, the bright bands fall on the inhibitory as well as the excitatory region of the ganglion cell resulting in lateral inhibition and account for the low-frequency drop-off of the human contrast sensitivity function.
One experimental phenomenon is the inhibition of blue in the periphery if blue light is displayed against white, leading to a yellow surrounding. The yellow is derived from the inhibition of blue on the surroundings by the center. Since white minus blue is red and green, this mixes to become yellow.
For example, in the case of graphical computer displays, contrast depends on the properties of the picture source or file and the properties of the computer display, including its variable settings. For some screens the angle between the screen surface and the observer's line of sight is also important.
Formula
There are many possible definitions of contrast. Some include color; others do not. Travnikova laments, "Such a multiplicity of notions of contrast is extremely inconvenient. It complicates the solution of many applied problems and makes it difficult to compare the results published by different authors."
Various definitions of contrast are used in different situations. Here, luminance contrast is used as an example, but the formulas can also be applied to other physical quantities. In many cases, the definitions of contrast represent a ratio of the type
The rationale behind this is that a small difference is negligible if the average luminance is high, while the same small difference matters if the average luminance is low (see Weber–Fechner law). Below, some common definitions are given.
Weber contrast
Weber contrast is defined as
with
Michelson contrast
Michelson contrast (also known as the visibility) is commonly used for patterns where both bright and dark features are equivalent and take up similar fractions of the area (e.g. sine-wave gratings). The Michelson contrast is defined as
with
This form of contrast is an effective way to quantify contrast for periodic functions f(x) and is also known as the modulation mf of a periodic signal f. Modulation quantifies the relative amount by which the amplitude (or difference) (fmax − fmin)/2 of f stands out from the average value (or background) (fmax + fmin)/2. In general, mf refers to the contrast of the periodic signal f relative to its average value. If mf = 0, then f has no contrast. If two periodic functions f and g have the same average value, then f has more contrast than g if mf > mg.
RMS contrast
Root mean square (RMS) contrast does not depend on the angular frequency content or the spatial distribution of contrast in the image. RMS contrast is defined as the standard deviation of the pixel intensities:
where intensities
Contrast sensitivity
Contrast sensitivity is a measure of the ability to discern between luminances of different levels in a static image. Contrast sensitivity varies between individuals, reaching a maximum at approximately 20 years of age, and at angular frequencies of about 2–5 cycles per degree. In addition it can decline with age and also due to other factors such as cataracts and diabetic retinopathy.
Contrast sensitivity and visual acuity
Visual acuity is a parameter that is frequently used to assess overall vision. However, diminished contrast sensitivity may cause decreased visual function in spite of normal visual acuity. For example, some individuals with glaucoma may achieve 20/20 vision on acuity exams, yet struggle with activities of daily living, such as driving at night.
As mentioned above, contrast sensitivity describes the ability of the visual system to distinguish bright and dim components of a static image. Visual acuity can be defined as the angle with which one can resolve two points as being separate, given that the image is shown with 100% contrast and is projected onto the fovea of the retina. Thus, when an optometrist or ophthalmologist assesses a patient’s visual acuity using a Snellen chart or some other acuity chart, the target image is displayed at high contrast, e.g., black letters of decreasing size on a white background. A subsequent contrast sensitivity exam may demonstrate difficulty with decreased contrast (using, e.g., the Pelli-Robson chart, which consists of uniform-sized but increasingly pale grey letters on a white background).
To assess a patient’s contrast sensitivity, one of several diagnostic exams may be used. Most charts in an ophthalmologist’s or optometrist's office will show images of varying contrast and angular frequency. Parallel bars of varying width and contrast, known as sine-wave gratings, are sequentially viewed by the patient. The width of the bars and their distance apart represent angular frequency, measured in cycles per degree (cpd or cyc/deg).
Studies have demonstrated that medium-level angular frequency, approximately 5–7 cycles per degree, is optimally detected by most individuals, compared with low- or high-level angular frequencies. The contrast threshold can be defined as the minimum contrast that can be resolved by the patient. The contrast sensitivity is equal to 1/contrast-threshold.
Using the results of a contrast sensitivity exam, a contrast sensitivity curve can be plotted, with angular frequency on the horizontal, and contrast threshold on the vertical axis. Also known as contrast sensitivity function (CSF), the plot demonstrates the normal range of contrast sensitivity, and will indicate diminished contrast sensitivity in patients who fall below the normal curve. Some graphs contain “contrast sensitivity acuity equivalents”, with lower acuity values falling in the area under the curve. In patients with normal visual acuity and concomitant reduced contrast sensitivity, the area under the curve serves as a graphical representation of the visual deficit. It can be because of this impairment in contrast sensitivity that patients have difficulty driving at night, climbing stairs and other activities of daily living in which contrast is reduced.
Recent studies have demonstrated that intermediate-frequency sinusoidal patterns are optimally-detected by the retina due to the center-surround arrangement of neuronal receptive fields. In an intermediate angular frequency, the peak (brighter bars) of the pattern is detected by the center of the receptive field, while the troughs (darker bars) are detected by the inhibitory periphery of the receptive field. For this reason, low- and high-angular frequencies elicit excitatory and inhibitory impulses by overlapping frequency peaks and troughs in the center and periphery of the neuronal receptive field. Other environmental, physiologic and anatomical factors influence the neuronal transmission of sinusoidal patterns, including adaptation.
Decreased contrast sensitivity arises from multiple etiologies, including retinal disorders such as Age-Related Macular Degeneration (ARMD), amblyopia, lens abnormalities, such as cataract, and by higher-order neural dysfunction, including stroke and Alzheimer's disease. In light of the multitude of etiologies leading to decreased contrast sensitivity, contrast sensitivity tests are useful in the characterization and monitoring of dysfunction, and less helpful in detection of disease.