
 | ||
Causes of income inequality in the United States describes why changes in the country's income distribution are occurring. This topic is subject to extensive ongoing research, media attention, and political interest, as it involves how the national income of the country is split among its people at various income levels.
Contents
- Overview
- Globalization
- Superstar hypothesis
- Education
- Skill biased technological change
- Race and gender disparities
- Incentives
- Stock buybacks
- Background
- Income taxes
- Taxes on capital
- Other tax policies
- Debate over effects of tax policies
- Transfer payments
- Tax expenditures
- Shifts in political power
- Decline of unions
- Political parties and presidents
- Non party political action
- Immigration
- Wage theft
- Corporatism
- Neoliberalism
- References
Overview
Income inequality in the United States has grown significantly since the early 1970s, after several decades of stability, and has been the subject of study of many scholars and institutions. The U.S. consistently exhibits higher rates of income inequality than most developed nations, arguably due to the nation's relatively enhanced support of free market capitalism.
According to the CBO and others, "the precise reasons for the [recent] rapid growth in income at the top are not well understood", but "in all likelihood," an "interaction of multiple factors" was involved. "Researchers have offered several potential rationales." Some of these rationales conflict, some overlap. They include:
Paul Krugman put several of these factors into context in January 2015: "Competition from emerging-economy exports has surely been a factor depressing wages in wealthier nations, although probably not the dominant force. More important, soaring incomes at the top were achieved, in large part, by squeezing those below: by cutting wages, slashing benefits, crushing unions, and diverting a rising share of national resources to financial wheeling and dealing...Perhaps more important still, the wealthy exert a vastly disproportionate effect on policy. And elite priorities — obsessive concern with budget deficits, with the supposed need to slash social programs — have done a lot to deepen [wage stagnation and income inequality]."
Globalization
Globalization refers to the integration of economies in terms of trade, information, and jobs. Innovations in supply chain management enabled goods to be sourced in Asia and shipped to the United States less expensively than in the past. This integration of economies, particularly with the U.S. and Asia, had dramatic impacts on income inequality globally.
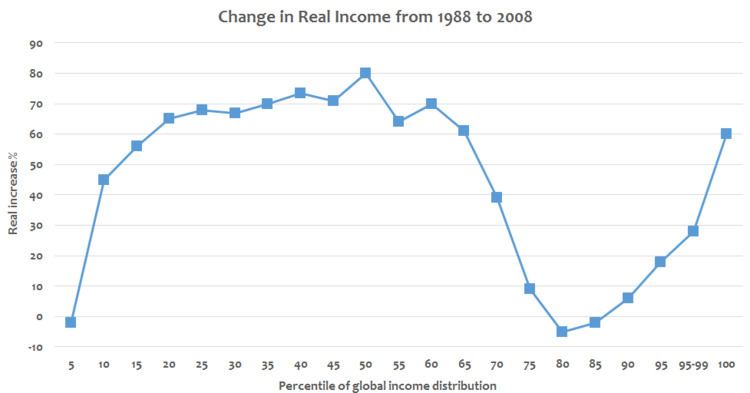
Economist Branko Milanovic analyzed global income inequality, comparing 1988 and 2008. His analysis indicated that the global top 1% and the middle classes of the emerging economies (e.g., China, India, Indonesia, Brazil and Egypt) were the main winners of globalization during that time. The real (inflation adjusted) income of the global top 1% increased approximately 60%, while the middle classes of the emerging economies (those around the 50th percentile of the global income distribution in 1988) rose 70–80%. For example, in 2000, 5 million Chinese households earned between $11,500 and $43,000 in 2016 dollars. By 2015, 225 million did. On the other hand, those in the middle class of the developed world (those in the 75th to 90th percentile in 1988, such as the American middle class) experienced little real income gains. The richest 1% contains 60 million persons globally, including 30 million Americans (i.e., the top 12% of Americans by income were in the global top 1% in 2008).
While economists who have studied globalization agree imports have had an effect, the timing of import growth does not match the growth of income inequality. China is the world's biggest exporter and maker of manufactured products but had a per capita income in 2007 one-seventh that of the United States. By 1995 imports of manufactured goods from low-wage countries totaled less than 3% of US gross domestic product.
It wasn't until 2006 that the US imported more manufactured goods from low-wage (developing) countries than from high-wage (advanced) economies. Inequality increased during the 2000–2010 decade not because of stagnating wages for less-skilled workers, but because of accelerating incomes of the top 0.1%. Author Timothy Noah estimates that "trade", increases in imports are responsible for just 10% of the "Great Divergence" in income distribution.
Journalist James Surowiecki notes that in the last 50 years, companies and the sectors of the economy providing the most employment in the US – major retailers, restaurant chains, and supermarkets – are ones with lower profit margins and less pricing power than in the 1960s; while sectors with high profit margins and average salaries – like high technology – have relatively few employees.
Some economists claim that it is WTO-led globalization and competition from developing countries, especially China, that has resulted in the recent decline in labor’s share of income and increased unemployment in the U.S. And the Economic Policy Institute and the Center for Economic and Policy Research argue that some trade agreements such as the Trans-Pacific Partnership could result in further job losses and declining wages.
One argument contrary to the globalization/technology hypothesis relates to variation across countries. Japan, Sweden and France did not experience significant increases in income inequality during the 1979–2010 period, although the U.S. did. The top 1% income group continued to receive less than 10% of the income share in these countries, while the U.S. share rose from 10% to over 20%. Economist Emmanuel Saez wrote in 2014: "Differences across countries rule out technical change/globalization as the sole explanation...Policies play a key role in shaping inequality (tax and transfer policies, regulations, education)."
Superstar hypothesis
Eric Posner and Glen Weyl point out that inequality can be predominantly explained by the superstar hypothesis. In their opinion Piketty fails to observe the accelerated turnover that is occurring in the Forbes 400; only 35 people from the original 1982 list remain today. Many have fallen off as a result of heavy spending, large-scale philanthropy, and bad investments. The current Forbes 400 is now primarily made up of newly wealthy business owners, not heirs and heiresses. In parallel research, the University of Chicago’s Steven Kaplan and Stanford University’s Joshua Rauh note that 69% of those on the Forbes list are actually first generation wealth creators. That figure has risen dramatically since 1982 when it stood at 40%.
Ed Dolan supports the globalization and superstar hypothesis but points out that the high earnings are based, to some extent, on moral hazard like "Bonus-based compensation schemes with inadequate clawback for losses" and the shift of losses to shareholders, unsecured creditors, or taxpayers. Paul Krugman argues that for the US the surge in inequality to date is mainly due to supersalaries but capital has nonetheless been significant too. And when the current generation of the 1% turn over their wealth to their heirs these become rentiers, people who live off accumulated capital. Two decades from now America could turn into a rentier-dominated society even more unequal than Belle Époque Europe.
Education
Income differences between the varying levels of educational attainment (usually measured by the highest degree of education an individual has completed) have increased. Expertise and skill certified through an academic degree translates into increased scarcity of an individual's occupational qualification which in turn leads to greater economic rewards. As the United States has developed into a post-industrial society more and more employers require expertise that they did not a generation ago, while the manufacturing sector which employed many of those lacking a post-secondary education is decreasing in size.
In the resulting economic job market the income discrepancy between the working class and the professional with the higher academic degrees, who possess scarce amounts of certified expertise, may be growing.
Households in the upper quintiles are generally home to more, better educated and employed working income earners, than those in lower quintiles. Among those in the upper quintile, 62% of householders were college graduates, 80% worked full-time and 76% of households had two or more income earners, compared to the national percentages of 27%, 58% and 42%, respectively. Upper-most sphere US Census Bureau data indicated that occupational achievement and the possession of scarce skills correlates with higher income.
Average earnings in 2002 for the population 18 years and over were higher at each progressively higher level of education... This relationship holds true not only for the entire population but also across most subgroups. Within each specific educational level, earnings differed by sex and race. This variation may result from a variety of factors, such as occupation, working full- or part-time, age, or labor force experience. –
The "college premium" refers to the increase in income to workers with four-year college degrees relative to those without. The college premium doubled from 1980 to 2005, as the demand for college-educated workers has exceeded the supply. Economists Goldin and Katz estimate that the increase in economic returns to education was responsible for about 60% of the increase in wage inequality between 1973 and 2005. The supply of available graduates did not keep up with business demand due primarily to increasingly expensive college educations. Annual tuition at public and private universities averaged 4% and 20% respectively of the annual median family income from the 1950s to 1970s; by 2005 these figures were 10% and 45% as colleges raised prices in response to demand. Economist David Autor wrote in 2014 that approximately two-thirds of the rise in income inequality between 1980 and 2005 was accounted for by the increased premium associated with education in general and post-secondary education in particular.
Two researchers have suggested that children in low income families are exposed to 636 words an hour, as opposed to 2,153 words in high income families during the first four formative years of a child's development. This, in turn, led to low achievement in later schooling due to the inability of the low income group to verbalize concepts.
A psychologist has stated that society stigmatizes poverty. Conversely, poor people tend to believe that the wealthy have been lucky or have earned their money through illegal means. She believes that both attitudes need to be discarded if the nation is to make headway in addressing the issue of inequality. She suggests that college not be a litmus test of success; that valorizing of one profession as more important than another is a problem.
Skill-biased technological change
As of the mid- to late- decade of the 2000s, the most common explanation for income inequality in America was "skill-biased technological change" (SBTC) – "a shift in the production technology that favors skilled over unskilled labor by increasing its relative productivity and, therefore, its relative demand". For example, one scholarly colloquium on the subject that included many prominent labor economists estimated that technological change was responsible for over 40% of the increase in inequality. Other factors like international trade, decline in real minimum wage, decline in unionization and rising immigration, were each responsible for 10–15% of the increase.
Education has a notable influence on income distribution. In 2005, roughly 55% of income earners with doctorate degrees – the most educated 1.4% – were among the top 15 percent earners. Among those with Master's degrees – the most educated 10% – roughly half had incomes among the top 20 percent of earners. Only among households in the top quintile were householders with college degrees in the majority.
But while the higher education commonly translates into higher income, and the highly educated are disproportionately represented in upper quintile households, differences in educational attainment fail to explain income discrepancies between the top 1 percent and the rest of the population. Large percentages of individuals lacking a college degree are present in all income demographics, including 33% of those with heading households with six figure incomes. From 2000 to 2010, the 1.5% of Americans with an M.D., J.D., or M.B.A. and the 1.5% with a PhD saw median income gains of approximately 5%. Among those with a college or master’s degree (about 25% of the American workforce) average wages dropped by about 7%, (though this was less than the decline in wages for those who had not completed college). Post-2000 data has provided "little evidence" for SBTC’s role in increasing inequality. The wage premium for college educated has risen little and there has been little shift in shares of employment to more highly skilled occupations.
Approaching the issue from occupations that have been replaced or downgraded since the late 1970s, one scholar found that jobs that "require some thinking but not a lot" – or moderately skilled middle-class occupations such as cashiers, typists, welders, farmers, appliance repairmen – declined the furthest in wage rates and/or numbers. Employment requiring either more skill or less has been less affected. However the timing of the great technological change of the era – internet use by business starting in the late 1990s – does not match that of the growth of income inequality (starting in the early 1970s but slackening somewhat in the 1990s). Nor does the introduction of technologies that increase the demand for more skilled workers seem to be generally associated with a divergence in household income among the population. Inventions of the 20th century such as AC electric power, the automobile, airplane, radio, television, the washing machine, Xerox machine, each had an economic impact similar to computers, microprocessors and internet, but did not coincide with greater inequality.
Another explanation is that the combination of the introduction of technologies that increase the demand for skilled workers, and the failure of the American education system to provide a sufficient increase in those skilled workers has bid up those workers' salaries. An example of the slowdown in education growth in America (that began about the same time as the Great Divergence began) is the fact that the average person born in 1945 received two more years of schooling than his parents, while the average person born in 1975 received only half a year more of schooling. Author Timothy Noah's "back-of-the-envelope" estimation based on "composite of my discussions with and reading of the various economists and political scientists" is that the "various failures" in America's education system are "responsible for 30%" of the post-1978 increase in inequality.
Race and gender disparities
Income levels vary by gender and race with median income levels considerably below the national median for females compared to men with certain racial demographics.
Despite considerable progress in pursuing gender and racial equality, some social scientists attribute these discrepancies in income partly to continued discrimination.
Among women, part of the wage gap is due to employment choices and preferences. Women are more likely to consider factors other than salary when looking for employment. On average, women are less willing to travel or relocate, take more hours off and work fewer hours, and choose college majors that lead to lower paying jobs. Women are also more likely to work for governments or non-profits which pay less than the private sector. According to this perspective certain ethnic minorities and women receive fewer promotions and opportunities for occupation and economic advancement than others. In the case of women this concept is referred to as the glass ceiling keeping women from climbing the occupational ladder.
In terms of race, Asian Americans are far more likely to be in the highest earning 5 percent than the rest of Americans. Studies have shown that African Americans are less likely to be hired than White Americans with the same qualifications. The continued prevalence of traditional gender roles and ethnic stereotypes may partially account for current levels of discrimination. In 2005, median income levels were highest among Asian and White males and lowest among females of all races, especially those identifying as African American or Hispanic. Despite closing gender and racial gaps, considerable discrepancies remain among racial and gender demographics, even at the same level of educational attainment. The economic success of Asian Americans may come from how they devote much more time to education than their peers. Asian Americans have significantly higher college graduation rates than their peers and are much more likely to enter high status and high income occupations.
Since 1953 the income gap between male and female workers has decreased considerably but remains relatively large. Women currently earn significantly more Associate's, Bachelor's, and Master's degrees than men and almost as many Doctorates. Women are projected to have passed men in Doctorates earned in 2006–2007, and to earn nearly two thirds of Associate's, Bachelor's, and Master's degrees by 2016. Despite this, some still argue that male workers still hold higher educational attainment, as the success of women in academia is a relatively new phenomenon.
Though it is important to note that income inequality between sexes remained stark at all levels of educational attainment. Between 1953 and 2005 median earnings as well as educational attainment increased, at a far greater pace for women than for men. Median income for female earners male earners increased 157.2% versus 36.2% for men, over four times as fast. Today the median male worker earns roughly 68.4% more than their female counterparts, compared to 176.3% in 1953. The median income of men in 2005 was 2% higher than in 1973 compared to a 74.6% increase for female earners.
Racial differences remained stark as well, with the highest earning sex-gender demographic of workers aged 25 or older, Asian males (who were roughly tied with white males) earning slightly more than twice as much as the lowest-earning demographic, Hispanic females. As mentioned above, inequality between races and gender persisted at similar education levels. Racial differences were overall more pronounced among male than among female income earners. In 2009, Hispanics were more than twice as likely to be poor than non-Hispanic whites, research indicates. Lower average English ability, low levels of educational attainment, part-time employment, the youthfulness of Hispanic household heads, and the 2007–09 recession are important factors that have pushed up the Hispanic poverty rate relative to non-Hispanic whites. During the early 1920s, median earnings decreased for both sexes, not increasing substantially until the late 1990s. Since 1974 the median income for workers of both sexes increased by 31.7% from $18,474 to $24,325, reaching its high-point in 2000.
Incentives
In the context of concern over income inequality, a number of economists, such as Federal Reserve Chairman Ben Bernanke, have talked about the importance of incentives: "... without the possibility of unequal outcomes tied to differences in effort and skill, the economic incentive for productive behavior would be eliminated, and our market-based economy ... would function far less effectively."
Since abundant supply decreases market value, the possession of scarce skills considerably increases income. Among the American lower class, the most common source of income was not occupation, but government welfare.
Stock buybacks
Writing in the Harvard Business Review in September 2014, William Lazonick blamed record corporate stock buybacks for reduced investment in the economy and a corresponding impact on prosperity and income inequality. Between 2003 and 2012, the 449 companies in the S&P 500 used 54% of their earnings ($2.4 trillion) to buy back their own stock. An additional 37% was paid to stockholders as dividends. Together, these were 91% of profits. This left little for investment in productive capabilities or higher income for employees, shifting more income to capital rather than labor. He blamed executive compensation arrangements, which are heavily based on stock options, stock awards and bonuses for meeting earnings per share (EPS) targets (EPS increases as the number of outstanding shares decreases). Restrictions on buybacks were greatly eased in the early 1980s. He advocates changing these incentives to limit buybacks.
U.S. companies are projected to increase buybacks to $701 billion in 2015 according to Goldman Sachs, an 18% increase over 2014. For scale, annual non-residential fixed investment (a proxy for business investment and a major GDP component) was estimated to be about $2.1 trillion for 2014.
Journalist Timothy Noah wrote in 2012 that: "My own preferred hypothesis is that stockholders appropriated what once belonged to middle-class wage earners." Since the vast majority of stocks are owned by higher income households, this contributes to income inequality. Journalist Harold Meyerson wrote in 2014 that: "The purpose of the modern U.S. corporation is to reward large investors and top executives with income that once was spent on expansion, research, training and employees."
Background
U.S. income inequality is comparable to other developed nations pre-tax, but is among the worst after-tax and transfers. This indicates the U.S. tax policies redistribute income from higher income to lower income households relatively less than other developed countries. Journalist Timothy Noah summarized the results of several studies his 2012 book The Great Divergence:
Income taxes
A key factor in income inequality/equality is the effective rate at which income is taxed coupled with the progressivity of the tax system. A progressive tax is a tax in which the effective tax rate increases as the taxable base amount increases. Overall income tax rates in the U.S. are below the OECD average, and until 2005 have been declining.
How much tax policy change over the last thirty years has contributed to income inequality is disputed. In their comprehensive 2011 study of income inequality (Trends in the Distribution of Household Income Between 1979 and 2007), the CBO found that,
The top fifth of the population saw a 10-percentage-point increase in their share of after-tax income. Most of that growth went to the top 1 percent of the population. All other groups saw their shares decline by 2 to 3 percentage points. In 2007, federal taxes and transfers reduced the dispersion of income by 20 percent, but that equalizing effect was larger in 1979. The share of transfer payments to the lowest-income households declined. The overall average federal tax rate fell.
However, a more recent CBO analysis indicates that with changes to 2013 tax law (e.g., the expiration of the 2001-2003 Bush tax cuts for top earners and the increased payroll taxes passed as part of the Affordable Care Act), the effective federal tax rates for the highest earning household will increase to levels not seen since 1979.
According to journalist Timothy Noah, "you can't really demonstrate that U.S. tax policy had a large impact on the three-decade income inequality trend one way or the other. The inequality trend for pre-tax income during this period was much more dramatic." Noah estimates tax changes account for 5% of the Great Divergence.
But many – such as economist Paul Krugman – emphasize the effect of changes in taxation – such as the 2001 and 2003 Bush administration tax cuts which cut taxes far more for high-income households than those below – on increased income inequality.
Part of the growth of income inequality under Republican administrations (described by Larry Bartels) has been attributed to tax policy. A study by Thomas Piketty and Emmanuel Saez found that "large reductions in tax progressivity since the 1960s took place primarily during two periods: the Reagan presidency in the 1980s and the Bush administration in the early 2000s."
During Republican President Ronald Reagan's tenure in office the top marginal income tax rate was reduced from over 70 to 28 percent, high top marginal rates like 70% being the sort in place during much of the period of great income equality following the "Great Compression". The lowest marginal rate for the bottom fell from 14 to 11 percent. However the effective rate on top earners before Reagan's tax cut was much lower because of loopholes and charitable contributions.
Taxes on capital
Taxes on income derived from capital (e.g., financial assets, property and businesses) primarily affect higher income groups, who own the vast majority of capital. For example, in 2010 approximately 81% of stocks were owned by the top 10% income group and 69% by the top 5%. Only about one-third of American households have stock holdings more than $7,000. Therefore, since higher-income taxpayers have a much higher share of their income represented by capital gains, lowering taxes on capital income and gains increases after-tax income inequality.
Capital gains taxes were reduced around the time income inequality began to rise again around 1980 and several times thereafter. During 1978 under President Carter, the top capital gains tax rate was reduced from 49% to 28%. President Ronald Reagan's 1981 cut in the top rate on unearned income reduced the maximum capital gains rate to only 20% – its lowest level since the Hoover administration, as part of an overall economic growth strategy. The capital gains tax rate was also reduced by President Bill Clinton in 1997, from 28% to 20%. President George W. Bush reduced the tax rate on capital gains and qualifying dividends from 20% to 15%, less than half the 35% top rate on ordinary income.
CBO reported in August 1990 that: "Of the 8 studies reviewed, five, including the two CBO studies, found that cutting taxes on capital gains is not likely to increase savings, investment, or GNP much if at all." Some of the studies indicated the loss in revenue from lowering the tax rate may be offset by higher economic growth, others did not.
Journalist Timothy Noah wrote in 2012 that: "Every one of these changes elevated the financial interests of business owners and stockholders above the well-being, financial or otherwise, or ordinary citizens." So overall, while cutting capital gains taxes adversely affects income inequality, its economic benefits are debatable.
Other tax policies
Rising inequality has also been attributed to President Bush's veto of tax harmonization, as this would have prohibited offshore tax havens.
Debate over effects of tax policies
One study found reductions of total effective tax rates were most significant for individuals with highest incomes. (see "Federal Tax Rate by Income Group" chart) For those with incomes in the top 0.01 percent, overall rates of Federal tax fell from 74.6% in 1970, to 34.7% in 2004 (the reversal of the trend in 2000 with a rise to 40.8% came after the 1993 Clinton deficit reduction tax bill), the next 0.09 percent falling from 59.1% to 34.1%, before leveling off with a relatively modest drop of 41.4 to 33.0% for the 99.5–99.9 percent group. Although the tax rate for low-income earners fell as well (though not as much), these tax reductions compare with virtually no change – 23.3% tax rate in 1970, 23.4% in 2004 – for the US population overall.
The study found the decline in progressivity since 1960 was due to the shift from allocation of corporate income taxes among labor and capital to the effects of the individual income tax. Paul Krugman also supports this claim saying, "The overall tax rate on these high income families fell from 36.5% in 1980 to 26.7% in 1989."
From the White House's own analysis, the federal tax burden for those making greater than $250,000 fell considerably during the late 1980s, 1990s and 2000s, from an effective tax of 35% in 1980, down to under 30% from the late 1980s to 2011.
Many studies argue that tax changes of S corporations confound the statistics prior to 1990. However, even after these changes inflation-adjusted average after-tax income grew by 25% between 1996 and 2006 (the last year for which individual income tax data is publicly available). This average increase, however, obscures a great deal of variation. The poorest 20% of tax filers experienced a 6% reduction in income while the top 0.1 percent of tax filers saw their income almost double. Tax filers in the middle of the income distribution experienced about a 10% increase in income. Also during this period, the proportion of income from capital increased for the top 0.1 percent from 64% to 70%.
Transfer payments
Transfer payments refer to payments to persons such as social security, unemployment compensation, or welfare. CBO reported in November 2014 that: "Government transfers reduce income inequality because the transfers received by lower-income households are larger relative to their market income than are the transfers received by higher-income households. Federal taxes also reduce income inequality, because the taxes paid by higher-income households are larger relative to their before-tax income than are the taxes paid by lower-income households. The equalizing effects of government transfers were significantly larger than the equalizing effects of federal taxes from 1979 to 2011.
CBO also reported that less progressive tax and transfer policies have contributed to greater after-tax income inequality: "As a result of the diminishing effect of transfers and federal taxes, the Gini index for income after transfers and federal taxes grew by more than the index for market income. Between 1979 and 2007, the Gini index for market income increased by 23 percent, the index for market income after transfers increased by 29 percent, and the index for income measured after transfers and federal taxes increased by 33 percent."
Tax expenditures
Tax expenditures (i.e., exclusions, deductions, preferential tax rates, and tax credits) cause revenues to be much lower than they would otherwise be for any given tax rate structure. The benefits from tax expenditures, such as income exclusions for healthcare insurance premiums paid for by employers and tax deductions for mortgage interest, are distributed unevenly across the income spectrum. They are often what the Congress offers to special interests in exchange for their support. According to a report from the CBO that analyzed the 2013 data:
Understanding how each tax expenditure is distributed across the income spectrum can inform policy choices.
Shifts in political power
Paul Krugman wrote in 2015 that: "Economists struggling to make sense of economic polarization are, increasingly, talking not about technology but about power." This market power hypothesis basically asserts that market power has concentrated in monopolies and oligopolies that enable unusual amounts of income ("rents") to be transferred from the many consumers to relatively few owners. This hypothesis is consistent with higher corporate profits without a commensurate rise in investment, as firms facing less competition choose to pass a greater share of their profits to shareholders (such as through share buybacks and dividends) rather than re-invest in the business to ward off competitors.
One cause of this concentration of market power was the rightward shift in American politics toward more conservative policies since 1980, as politics plays a big role in how market power can be exercised. Policies that removed barriers to monopoly and oligopoly included anti-union laws, reduced anti-trust activity, deregulation (or failure to regulate) non-depository banking, contract laws that favored creditors over debtors, etc. Further, rising wealth concentration can be used to purchase political influence, creating a feedback loop.
Decline of unions
The era of inequality growth has coincided with a dramatic decline in labor union membership from 20% of the labor force in 1983 to about 12% in 2007. Economists have traditionally thought that since the chief purpose of a union is to maximize the income of its members, a strong but not all-encompassing union movement led to increased income inequality. Given the increase in income inequality of the past few decades, either the sign of the effect must be reversed, the magnitude of the effect small, or a much larger opposing force overridden it, since unionization has decreased in that period.
However, more recently, research has shown that unions' ability to reduce income disparities among members outweighed other factors and its net effect has been to reduce national income inequality. The decline of unions has hurt this leveling effect among men, and one economist (Berkeley economist David Card) estimating about 15–20% of the "Great Divergence" among that gender is the result of declining unionization.
According to scholars, "As organized labor's political power dissipates, economic interests in the labor market are dispersed and policy makers have fewer incentives to strengthen unions or otherwise equalize economic rewards." Unions were a balancing force, helping ensure wages kept up with productivity and that neither executives nor shareholders were unduly rewarded. Further, societal norms placed constraints on executive pay. This changed as union power declined (the share of unionized workers fell significantly during the Great Divergence, from over 30% to around 12%) and CEO pay skyrocketed (rising from around 40 times the average workers pay in the 1970s to over 350 times in the early 2000s). A 2015 report by the International Monetary Fund also attributes the decline of labor's share of GDP to deunionization, noting the trend "necessarily increases the income share of corporate managers’ pay and shareholder returns . . . Moreover, weaker unions can reduce workers’ influence on corporate decisions that benefit top earners, such as the size and structure of top executive compensation."
Still other researchers think it is the labor movement's loss of national political power to promote equalizing "government intervention and changes in private sector behavior" has had the greatest impact on inequality in the US. Sociologist Jake Rosenfeld of the University of Washington argues that labor unions were the primary institution fighting inequality in the United States and helped grow a multiethnic middle class, and their decline has resulted in diminishing prospects for U.S. workers and their families. Timothy Noah estimates the "decline" of labor union power "responsible for 20%" of the Great Divergence. While the decline of union power in the US has been a factor in declining middle class incomes, they have retained their clout in Western Europe. In Denmark, influential trade unions such as Fagligt Fælles Forbund (3F) ensure that fast-food workers earn a living wage, the equivalent of $20 an hour, which is more than double the hourly rate for their counterparts in the United States.
Critics of technological change as an explanation for the "Great Divergence" of income levels in America point to public policy and party politics, or "stuff the government did, or didn't do". They argue these have led to a trend of declining labor union membership rates and resulting diminishing political clout, decreased expenditure on social services, and less government redistribution. Moreover, the United States is the only advanced economy without a labor-based political party.
As of 2011, several state legislatures have launched initiatives aimed at lowering wages, labor standards, and workplace protections for both union and non-union workers.
Political parties and presidents
Liberal political scientist Larry Bartels has found a strong correlation between the party of the president and income inequality in America since 1948. (see below) Examining average annual pre-tax income growth from 1948 to 2005 (which encompassed most of the egalitarian Great Compression and the entire inegalitarian Great Divergence) Bartels shows that under Democratic presidents (from Harry Truman forward), the greatest income gains have been at the bottom of the income scale and tapered off as income rose. Under Republican presidents, in contrast, gains were much less but what growth there was concentrated towards the top, tapering off as you went down the income scale.
Summarizing Bartels's findings, journalist Timothy Noah referred to the administrations of Democratic presidents as "Democrat-world", and GOP administrations as "Republican-world":
In Democrat-world, pre-tax income increased 2.64% annually for the poor and lower-middle-class and 2.12% annually for the upper-middle-class and rich. There was no Great Divergence. Instead, the Great Compression – the egalitarian income trend that prevailed through the 1940s, 1950s, and 1960s – continued to the present, albeit with incomes converging less rapidly than before. In Republican-world, meanwhile, pre-tax income increased 0.43 percent annually for the poor and lower-middle-class and 1.90 percent for the upper-middle-class and rich. Not only did the Great Divergence occur; it was more greatly divergent. Also of note: In Democrat-world pre-tax income increased faster than in the real world not just for the 20th percentile but also for the 40th, 60th, and 80th. We were all richer and more equal! But in Republican-world, pre-tax income increased slower than in the real world not just for the 20th percentile but also for the 40th, 60th, and 80th. We were all poorer and less equal! Democrats also produced marginally faster income growth than Republicans at the 95th percentile, but the difference wasn't statistically significant.
The pattern of distribution of growth appears to be the result of a whole host of policies,
including not only the distribution of taxes and benefits but also the government's stance toward unions, whether the minimum wage rises, the extent to which the government frets about inflation versus too-high interest rates, etc., etc.
Noah admits the evidence of this correlation is "circumstantial rather than direct", but so is "the evidence that smoking is a leading cause of lung cancer."
Non-party political action
According to political scientists Jacob Hacker and Paul Pierson writing in the book Winner-Take-All Politics, the important policy shifts were brought on not by the Republican Party but by the development of a modern, efficient political system, especially lobbying, by top earners – and particularly corporate executives and the financial services industry. The end of the 1970s saw a transformation of American politics away from a focus on the middle class, with new, much more effective, aggressive and well-financed lobbyists and pressure groups acting on behalf of upper income groups. Executives successfully eliminated any countervailing power or oversight of corporate managers (from private litigation, boards of directors and shareholders, the Securities and Exchange Commission or labor unions).
The financial industry's success came from successfully pushing for deregulation of financial markets, allowing much more lucrative but much more risky investments from which it privatized the gains while socializing the losses with government bailouts. (the two groups formed about 60% of the top 0.1 percent of earners.) All top earners were helped by deep cuts in estate and capital gains taxes, and tax rates on high levels of income.
Arguing against the proposition that the explosion in pay for corporate executives – which grew from 35X average worker pay in 1978 to over 250X average pay before the 2007 recession – is driven by an increased demand for scarce talent and set according to performance, Krugman points out that multiple factors outside of executives' control govern corporate profitability, particularly in short term when the head of a company like Enron may look like a great success. Further, corporate boards follow other companies in setting pay even if the directors themselves disagree with lavish pay "partly to attract executives whom they consider adequate, partly because the financial market will be suspicious of a company whose CEO isn't lavishly paid." Finally "corporate boards, largely selected by the CEO, hire compensation experts, almost always chosen by the CEO" who naturally want to please their employers.
Lucian Arye Bebchuk, Jesse M. Fried, the authors of Pay Without Performance, critique of executive pay, argue that executive capture of corporate governance is so complete that only public relations, i.e. public `outrage`, constrains their pay. This in turn has been reduced as traditional critics of excessive pay – such as politicians (where need for campaign contributions from the richest outweighs populist indignation), media (lauding business genius), unions (crushed) – are now silent.
In addition to politics, Krugman postulated change in norms of corporate culture have played a factor. In the 1950s and 60s, corporate executives had (or could develop) the ability to pay themselves very high compensation through control of corporate boards of directors, they restrained themselves. But by the end of the 1990s, the average real annual compensation of the top 100 C.E.O.'s skyrocketed from $1.3 million – 39 times the pay of an average worker – to $37.5 million, more than 1,000 times the pay of ordinary workers from 1982 to 2002. Journalist George Packer also sees the dramatic increase in inequality in America as a product of the change in attitude of the American elite, which (in his view) has been transitioning itself from pillars of society to a special interest group. Author Timothy Noah estimates that what he calls "Wall Street and corporate boards' pampering" of the highest earning 0.1% is "responsible for 30%" of the post-1978 increase in inequality.
Immigration
The Immigration and Nationality Act of 1965 increased immigration to America, especially of non-Europeans. From 1970 to 2007, the foreign-born proportion of America's population grew from 5% to 11%, most of whom had lower education levels and incomes than native-born Americans. But the contribution of this increase in supply of low-skill labor seem to have been relatively modest. One estimate stated that immigration reduced the average annual income of native-born "high-school dropouts" ("who roughly correspond to the poorest tenth of the workforce") by 7.4% from 1980 to 2000. The decline in income of better educated workers was much less. Author Timothy Noah estimates that "immigration" is responsible for just 5% of the "Great Divergence" in income distribution, as does economist David Card.
While immigration was found to have slightly depressed the wages of the least skilled and least educated American workers, it doesn't explain rising inequality among high school and college graduates. Scholars such as political scientists Jacob S. Hacker, Paul Pierson, Larry Bartels and Nathan Kelly, and economist Timothy Smeeding question the explanation of educational attainment and workplace skills point out that other countries with similar education levels and economies have not gone the way of the US, and that the concentration of income in the US hasn't followed a pattern of "the 29% of Americans with college degrees pulling away" from those who have less education.
Wage theft
A September 2014 report by the Economic Policy Institute claims wage theft is also responsible for exacerbating income inequality: "Survey evidence suggests that wage theft is widespread and costs workers billions of dollars a year, a transfer from low-income employees to business owners that worsens income inequality, hurts workers and their families, and damages the sense of fairness and justice that a democracy needs to survive."
Corporatism
Edmund Phelps, published an analysis in 2010 theorizing that the cause of income inequality is not free market capitalism, but instead is the result of the rise of corporatism. Corporatism, in his view, is the antithesis of free market capitalism. It is characterized by semi-monopolistic organizations and banks, big employer confederations, often acting with complicit state institutions in ways that discourage (or block) the natural workings of a free economy. The primary effects of corporatism are the consolidation of economic power and wealth with end results being the attrition of entrepreneurial and free market dynamism.
His follow-up book, Mass Flourishing, further defines corporatism by the following attributes: power-sharing between government and large corporations (exemplified in the U.S. by widening government power in areas such as financial services, healthcare, and energy through regulation), an expansion of corporate lobbying and campaign support in exchange for government reciprocity, escalation in the growth and influence of financial and banking sectors, increased consolidation of the corporate landscape through merger and acquisition (with ensuing increases in corporate executive compensation), increased potential for corporate/government corruption and malfeasance, and a lack of entrepreneurial and small business development leading to lethargic and stagnant economic conditions.
Today, in the United States, virtually all of these economic conditions are being borne out. With regard to income inequality, the 2014 income analysis of University of California, Berkeley economist Emmanuel Saez confirms that relative growth of income and wealth is not occurring among small and mid-sized entrepreneurs and business owners (who generally populate the lower half of top one per-centers in income), but instead only among the top .1 percent of income distribution ... whom Paul Krugman describes as "super-elites - corporate bigwigs and financial wheeler-dealers."... who earn $2,000,000 or more every year.
For example, measured relative to GDP, total compensation and its component wages and salaries have been declining since 1970. This indicates a shift in income from labor (persons who derive income from hourly wages and salaries) to capital (persons who derive income via ownership of businesses, land and assets). Wages and salaries have fallen from approximately 51% GDP in 1970 to 43% GDP in 2013. Total compensation has fallen from approximately 58% GDP in 1970 to 53% GDP in 2013. To put this in perspective, five percent of U.S. GDP was approximately $850 billion in 2013. This represents an additional $7,000 in wages and salaries for each of the 120 million U.S. households. Larry Summers estimated in 2007 that the lower 80% of families were receiving $664 billion less income than they would be with a 1979 income distribution (a period of much greater equality), or approximately $7,000 per family.
Not receiving this income may have led many families to increase their debt burden, a significant factor in the 2007-2009 subprime mortgage crisis, as highly leveraged homeowners suffered a much larger reduction in their net worth during the crisis. Further, since lower income families tend to spend relatively more of their income than higher income families, shifting more of the income to wealthier families may slow economic growth.
In another example, The Economist propounds that a swelling corporate financial and banking sector has caused Gini Coefficients to rise in the U.S. since 1980: "Financial services' share of GDP in America doubled to 8% between 1980 and 2000; over the same period their profits rose from about 10% to 35% of total corporate profits, before collapsing in 2007–09. Bankers are being paid more, too. In America the compensation of workers in financial services was similar to average compensation until 1980. Now it is twice that average." The summary argument, considering these findings, is that if corporatism is the consolidation and sharing of economic and political power between large corporations and the state ... then a corresponding concentration of income and wealth (with resulting income inequality) is an expected by-product of such a consolidation.
Neoliberalism
Some economists, sociologists and anthropologists argue that neoliberalism, or the resurgence of 19th century theories relating to laissez-faire economic liberalism in the late 1970s, has been the significant driver of inequality. More broadly, according to The Handbook of Neoliberalism, the term has "become a means of identifying a seemingly ubiquitous set of market-oriented policies as being largely responsible for a wide range of social, political, ecological and economic problems." Vicenç Navarro points to policies pertaining to the deregulation of labor markets, privatization of public institutions, union busting and reduction of public social expenditures as contributors to this widening disparity. The privatization of public functions, for example, grows income inequality by depressing wages and eliminating benefits for middle class workers while increasing income for those at the top. The deregulation of the labor market undermined unions by allowing the real value of the minimum wage to plummet, resulting in employment insecurity and widening wage and income inequality. David M. Kotz, professor of economics at the University of Massachusetts Amherst, contends that neoliberalism "is based on the thorough domination of labor by capital." As such, the advent of the neoliberal era has seen a sharp increase in income inequality through the decline of unionization, stagnant wages for workers and the rise of CEO supersalaries. According to Emmanuel Saez:
The labor market has been creating much more inequality over the last thirty years, with the very top earners capturing a large fraction of macroeconomic productivity gains. A number of factors may help explain this increase in inequality, not only underlying technological changes but also the retreat of institutions developed during the New Deal and World War II - such as progressive tax policies, powerful unions, corporate provision of health and retirement benefits, and changing social norms regarding pay inequality.
Pennsylvania State University political science professor Pamela Blackmon attributes the trends of growing poverty and income inequality to the convergence of several neoliberal policies during Ronald Reagan's presidency, including the decreased funding of education, decreases in the top marginal tax rates, and shifts in transfer programs for those in poverty.
Fred L. Block and Margaret Somers, in expanding on Karl Polanyi's critique of laissez-faire theories in The Great Transformation, argue that Polanyi's analysis helps to explain why the revival of such ideas has contributed to the "persistent unemployment, widening inequality, and the severe financial crises that have stressed Western economies over the past forty years." John Schmitt and Ben Zipperer of the Center for Economic and Policy Research also point to economic liberalism as one of the causes of income inequality. They note that European nations, in particular the social democracies of Northern Europe with extensive and well funded welfare states, have lower levels of income inequality and social exclusion than the United States.