
 | ||
Income inequality in the United States has increased significantly since the 1970s after several decades of stability, meaning the share of the nation's income received by higher income households has increased. This trend is evident with income measured both before taxes (market income) as well as after taxes and transfer payments. Income inequality has fluctuated considerably since measurements began around 1915, moving in an arc between peaks in the 1920s and 2000s, with a 30-year period of relatively lower inequality between 1950–1980.
Contents
- Overview
- History
- Post 1970 increase
- Effects of 20072009 recession
- 2009present
- Causes
- Views that income inequality slows economic growth
- Views that income inequality does not slow growth
- Likelihood of financial crises
- Monopolization of labor consolidation and competition
- Aggregate demand and debt
- Over lifetimes
- Between generations
- Poverty
- Further enrichment of corporate top executives
- Effects on democracy and society
- Political polarization
- Political inequality
- Class system
- Political change
- Health
- Financing of social programs
- Education and human capital
- Public attitudes
- States and cities
- Comparisons by state
- Overall
- Reasons for relative performance
- Canada
- Resources available to children
- Affordable higher education
- Public welfare and infrastructure spending
- Taxes on the wealthy
- Reduce tax expenditures
- Corporate tax reform
- Minimum wages
- Maximum wage implementation
- Subsidies and income guarantees
- Rent seeking limits
- Economic democracy
- Monetary policy
- Internal Revenue Service IRS data
- Census Bureau data
- Income measures Pre and post tax
- Demographic issues
- Gini index
- Measuring inequality through consumption vs income
- Wealth inequality
- References
Measured for all households, U.S. income inequality is comparable to other developed countries before taxes and transfers, but is among the highest after taxes and transfers, meaning the U.S. shifts relatively less income from higher income households to lower income households. Measured for working-age households, market income inequality is comparatively high (rather than moderate) and the level of redistribution is moderate (not low). These comparisons indicate Americans shift from reliance on market income to reliance on income transfers later in life and less than households in other developed countries do.
The U.S. ranks around the 30th percentile in income inequality globally, meaning 70% of countries have a more equal income distribution. U.S. federal tax and transfer policies are progressive and therefore reduce income inequality measured after taxes and transfers. Tax and transfer policies together reduced income inequality slightly more in 2011 than in 1979.
While there is strong evidence that it has increased since the 1970s, there is active debate in the United States regarding the appropriate measurement, causes, effects and solutions to income inequality. The two major political parties have different approaches to the issue, with Democrats historically emphasizing that economic growth should result in shared prosperity (i.e., a pro-labor argument advocating income redistribution), while Republicans tend to downplay the validity or feasibility of positively influencing the issue (i.e., a pro-capital argument against redistribution).
Overview
U.S. income inequality has grown significantly since the early 1970s, after several decades of stability, and has been the subject of study of many scholars and institutions. The U.S. consistently exhibits higher rates of income inequality than most developed nations due to the nation's enhanced support of free market capitalism and less progressive spending on social services.
The top 1% of income earners received approximately 20% of the pre-tax income in 2013, versus approximately 10% from 1950 to 1980. The top 1% is not homogeneous, with the very top income households pulling away from others in the top 1%. For example, the top 0.1% of households received approximately 10% of the pre-tax income in 2013, versus approximately 3–4% between 1951–1981. According to IRS data, adjusted gross income (AGI) of approximately $430,000 was required to be in the top 1% in 2013.
Most of the growth in income inequality has been between the middle class and top earners, with the disparity widening the further one goes up in the income distribution. The bottom 50% earned 20% of the nation's pre-tax income in 1979; this fell steadily to 14% by 2007 and 13% by 2014. Income for the middle 40% group, a proxy for the middle class, fell from 45% in 1979 to 41% in both 2007 and 2014.
To put this change into perspective, if the US had the same income distribution it had in 1979, each family in the bottom 80% of the income distribution would have $11,000 more per year in income on average, or $916 per month. Half of the U.S. population lives in poverty or is low-income, according to U.S. Census data.
The trend of rising income inequality is also apparent after taxes and transfers. A 2011 study by the CBO found that the top earning 1 percent of households increased their income by about 275% after federal taxes and income transfers over a period between 1979 and 2007, compared to a gain of just under 40% for the 60 percent in the middle of America's income distribution. U.S. federal tax and transfer policies are progressive and therefore substantially reduce income inequality measured after taxes and transfers. They became moderately less progressive between 1979 and 2007 but slightly more progressive measured between 1979 and 2011. Income transfers had a greater impact on reducing inequality than taxes from 1979 to 2011.
Americans are not generally aware of the extent of inequality or recent trends. There is a direct relationship between actual income inequality and the public's views about the need to address the issue in most developed countries, but not in the U.S., where income inequality is worse but the concern is lower. The U.S. was ranked the 6th worst among 173 countries (4th percentile) on income equality measured by the Gini index.
There is significant and ongoing debate as to the causes, economic effects, and solutions regarding income inequality. While before-tax income inequality is subject to market factors (e.g., globalization, trade policy, labor policy, and international competition), after-tax income inequality can be directly affected by tax and transfer policy. U.S. income inequality is comparable to other developed nations before taxes and transfers, but is among the worst after taxes and transfers. Income inequality may contribute to slower economic growth, reduced income mobility, higher levels of household debt, and greater risk of financial crises and deflation.
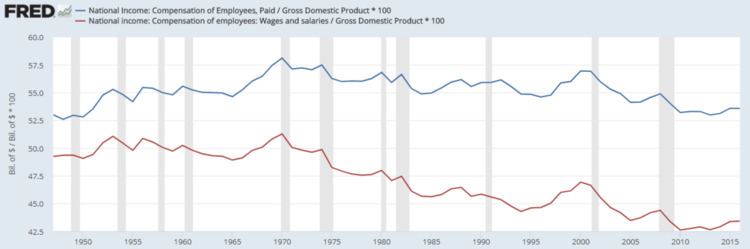
Labor (workers) and capital (owners) have always battled over the share of the economic pie each obtains. The influence of the labor movement has waned in the U.S. since the 1960s along with union participation and more pro-capital laws. The share of total worker compensation has declined from 58% of national income (GDP) in 1970 to nearly 53% in 2013, contributing to income inequality. This has led to concerns that the economy has shifted too far in favor of capital, via a form of corporatism, corpocracy or neoliberalism.
Although some have spoken out in favor of moderate inequality as a form of incentive, others have warned against the current high levels of inequality, including Yale Nobel prize for economics winner Robert J. Shiller, (who called rising economic inequality "the most important problem that we are facing now today"), former Federal Reserve Board chairman Alan Greenspan, ("This is not the type of thing which a democratic society – a capitalist democratic society – can really accept without addressing"), and President Barack Obama (who referred to the widening income gap as the "defining challenge of our time").
History
The level of concentration of income in the United States has fluctuated throughout its history. Going back to the early 20th Century, when income statistics started to become available, there has been a "great economic arc" from high inequality "to relative equality and back again," in the words of Nobel laureate economist Paul Krugman. In 1915, an era in which the Rockefellers and Carnegies dominated American industry, the richest 1% of Americans earned roughly 18% of all income. By 2007, the top 1 percent account for 24% of all income. In between, their share fell below 10% for three decades.
The first era of inequality lasted roughly from the post-civil war era ("the Gilded Age") to sometime around 1937. But from about 1937 to 1947 – a period that has been dubbed the "Great Compression" – income inequality in the United States fell dramatically. Highly progressive New Deal taxation, the strengthening of unions, and regulation of the National War Labor Board during World War II raised the income of the poor and working class and lowered that of top earners. This "middle class society" of relatively low level of inequality remained fairly steady for about three decades ending in early 1970s, the product of relatively high wages for the US working class and political support for income leveling government policies.
Wages remained relatively high because of lack of foreign competition for American manufacturing, and strong trade unions. By 1947 more than a third of non-farm workers were union members, and unions both raised average wages for their membership, and indirectly, and to a lesser extent, raised wages for workers in similar occupations not represented by unions. Scholars believe political support for equalizing government policies was provided by high voter turnout from union voting drives, the support of the otherwise conservative South for the New Deal, and prestige that the massive mobilization and victory of World War II had given the government.
Post-1970 increase
The return to high inequality or to what Krugman and journalist Timothy Noah have referred as the "Great Divergence", began in the 1970s. Studies have found income grew more unequal almost continuously except during the economic recessions in 1990–91, 2001 (Dot-com bubble), and 2007 sub-prime bust.
The Great Divergence differs in some ways from the pre-Depression era inequality. Before 1937, a larger share of top earners income came from capital (interest, dividends, income from rent, capital gains). After 1970, income of high-income taxpayers comes predominantly from labor: employment compensation.
Until 2011, the Great Divergence had not been a major political issue in America, but stagnation of middle-class income was. In 2009 the Barack Obama administration White House Middle Class Working Families Task Force convened to focus on economic issues specifically affecting middle-income Americans. In 2011, the Occupy movement drew considerable attention to income inequality in the country.
CBO reported that for the 1979-2007 period, after-tax income of households in the top 1 percent of earners grew by 275%, compared to 65% for the next 19%, just under 40% for the next 60%, 18% for the bottom fifth of households. "As a result of that uneven income growth," the report noted, "the share of total after-tax income received by the 1 percent of the population in households with the highest income more than doubled between 1979 and 2007, whereas the share received by low- and middle-income households declined.... The share of income received by the top 1 percent grew from about 8% in 1979 to over 17% in 2007. The share received by the other 19 percent of households in the highest income quintile (one fifth of the population as divided by income) was fairly flat over the same period, edging up from 35% to 36%."
According to the CBO, the major reason for observed rise in unequal distribution of after-tax income was an increase in market income, that is household income before taxes and transfers. Market income for a household is a combination of labor income (such as cash wages, employer-paid benefits, and employer-paid payroll taxes), business income (such as income from businesses and farms operated solely by their owners), capital gains (profits realized from the sale of assets and stock options), capital income (such as interest from deposits, dividends, and rental income), and other income. Of them, capital gains accounted for 80% of the increase in market income for the households in top 20%, in the 2000–2007 period. Even over the 1991–2000 period, according to the CBO, capital gains accounted for 45% of the market income for the top 20% households.
In a July 2015 op-ed article, Martin Feldstein, Professor of Economics at Harvard University, stated that the CBO found that from 1980 to 2010 real median household income rose by 15%. However, when the definition of income was expanded to include benefits and subtracted taxes, the CBO found that the median household's real income rose by 45%. Adjusting for household size, the gain increased to 53%.
Effects of 2007–2009 recession
Just as higher-income groups are more likely to enjoy financial gains when economic times are good, they are also likely to suffer more significant income losses during economic downturns and recessions when they are compared to lower income groups. Higher-income groups tend to derive relatively more of their income from more volatile sources related to capital income (business income, capital gains, and dividends), as opposed to labor income (wages and salaries). For example, in 2011 the top 1% of income earners derived 37% of their income from labor income, versus 62% for the middle quintile. On the other hand, the top 1% derived 58% of their income from capital as opposed to 4% for the middle quintile. Government transfers represented only 1% of the income of the top 1% but 25% for the middle quintile; the dollar amounts of these transfers tend to rise in recessions.
This effect occurred during the Great Recession of 2007–2009, when total income going to the bottom 99 percent of Americans declined by 11.6%, but fell by 36.3% for the top 1%. Declines were especially steep for capital gains, which fell by 75% in real (inflation-adjusted) terms between 2007 and 2009. Other sources of capital income also fell: interest income by 40% and dividend income by 33%. Wages, the largest source of income, fell by a more modest 6%.
The share of pretax income received by the top 1% fell from 18.7% in 2007 to 16.0% in 2008 and 13.4% in 2009, while the bottom four quintiles all had their share of pretax income increase from 2007 to 2009. The share of aftertax income received by the top 1% income group fell from 16.7%, in 2007, to 11.5%, in 2009.
2009–present
The distribution of household incomes has become more unequal during the post-2008 economic recovery as the effects of the recession reversed. CBO reported in November 2014 that the share of pre-tax income received by the top 1% had risen from 13.3% in 2009 to 14.6% in 2011. During 2012 alone, incomes of the wealthiest 1 percent rose nearly 20%, whereas the income of the remaining 99 percent rose 1% in comparison.
According to an article in The New Yorker, by 2012, the share of pre-tax income received by the top 1% had returned to its pre-crisis peak, at around 23% of the pre-tax income. This is based on widely cited data from economist Emmanuel Saez, which uses "market income" and relies primarily on IRS data. The CBO uses both IRS data and Census data in its computations and reports a lower pre-tax figure for the top 1%. The two series were approximately 5 percentage points apart in 2011 (Saez at about 19.7% versus CBO at 14.6%), which would imply a CBO figure of about 18% in 2012 if that relationship holds, a significant increase versus the 14.6% CBO reported for 2011. The share of after-tax income received by the top 1% rose from 11.5% in 2009 to 12.6% in 2011.
Inflation-adjusted pre-tax income for the bottom 90% of American families fell between 2010 and 2013, with the middle income groups dropping the most, about 6% for the 40th-60th percentiles and 7% for the 20th-40th percentiles. Incomes in the top decile rose 2%.
The top 1% captured 91% of the real income growth per family during the 2009-2012 recovery period, with their pre-tax incomes growing 34.7% adjusted for inflation while the pre-tax incomes of the bottom 99% grew 0.8%. Measured from 2009–2015, the top 1% captured 52% of the total real income growth per family, indicating the recovery was becoming less "lopsided" in favor of higher income families. By 2015, the top 10% (top decile) had a 50.5% share of the pre-tax income, close its highest all-time level.
Tax increases on higher income earners were implemented in 2013 due to the Affordable Care Act and American Taxpayer Relief Act of 2012. CBO estimated that "average federal tax rates under 2013 law would be higher – relative to tax rates in 2011 – across the income spectrum. The estimated rates under 2013 law would still be well below the average rates from 1979 through 2011 for the bottom four income quintiles, slightly below the average rate over that period for households in the 81st through 99th percentiles, and well above the average rate over that period for households in the top 1 percent of the income distribution." In 2016, the economists Peter H. Lindert and Jeffrey G. Williamson contended that inequality is the highest it has been since the nation's founding. French economist Thomas Piketty attributed the victory of Donald Trump in the 2016 presidential election, which he characterizes as an "electoral upset," to "the explosion in economic and geographic inequality in the United States over several decades and the inability of successive governments to deal with this."
Causes
According to the CBO and others, "the precise reasons for the [recent] rapid growth in income at the top are not well understood", but "in all likelihood," an "interaction of multiple factors" was involved. "Researchers have offered several potential rationales." Some of these rationales conflict, some overlap. They include:
Paul Krugman put several of these factors into context in January 2015: "Competition from emerging-economy exports has surely been a factor depressing wages in wealthier nations, although probably not the dominant force. More important, soaring incomes at the top were achieved, in large part, by squeezing those below: by cutting wages, slashing benefits, crushing unions, and diverting a rising share of national resources to financial wheeling and dealing...Perhaps more important still, the wealthy exert a vastly disproportionate effect on policy. And elite priorities – obsessive concern with budget deficits, with the supposed need to slash social programs – have done a lot to deepen [wage stagnation and income inequality]."
Overview
There is an ongoing debate as to the economic effects of income inequality. For example, Alan B. Krueger, President Obama's Chairman of the Council of Economic Advisors, summarized the conclusions of several research studies in a 2012 speech. In general, as income inequality worsens:
Among economists and related experts, many believe that America's growing income inequality is "deeply worrying", unjust, a danger to democracy/social stability, or a sign of national decline. Yale professor Robert Shiller, who was among three Americans who won the Nobel prize for economics in 2013, said after receiving the award, "The most important problem that we are facing now today, I think, is rising inequality in the United States and elsewhere in the world." Economist Thomas Piketty, who has spent nearly 20 years studying inequality primarily in the US, warns that "The egalitarian pioneer ideal has faded into oblivion, and the New World may be on the verge of becoming the Old Europe of the twenty-first century's globalized economy."
On the other side of the issue are those who have claimed that the increase is not significant, that it doesn't matter because America's economic growth and/or equality of opportunity are what's important, that it is a global phenomenon which would be foolish to try to change through US domestic policy, that it "has many economic benefits and is the result of ... a well-functioning economy", and has or may become an excuse for "class-warfare rhetoric", and may lead to policies that "reduce the well-being of wealthier individuals".
Views that income inequality slows economic growth
Economist Alan B. Krueger wrote in 2012: "The rise in inequality in the United States over the last three decades has reached the point that inequality in incomes is causing an unhealthy division in opportunities, and is a threat to our economic growth. Restoring a greater degree of fairness to the U.S. job market would be good for businesses, good for the economy, and good for the country." Krueger wrote that the significant shift in the share of income accruing to the top 1% over the 1979 to 2007 period represented nearly $1.1 trillion in annual income. Since the wealthy tend to save nearly 50% of their marginal income while the remainder of the population saves roughly 10%, other things equal this would reduce annual consumption (the largest component of GDP) by as much as 5%. Krueger wrote that borrowing likely helped many households make up for this shift, which became more difficult in the wake of the 2007–2009 recession.
Inequality in land and income ownership is negatively correlated with subsequent economic growth. A strong demand for redistribution will occur in societies where a large section of the population does not have access to the productive resources of the economy. Rational voters must internalize such issues. High unemployment rates have a significant negative effect when interacting with increases in inequality. Increasing inequality harms growth in countries with high levels of urbanization. High and persistent unemployment also has a negative effect on subsequent long-run economic growth. Unemployment may seriously harm growth because it is a waste of resources, because it generates redistributive pressures and distortions, because it depreciates existing human capital and deters its accumulation, because it drives people to poverty, because it results in liquidity constraints that limit labor mobility, and because it erodes individual self-esteem and promotes social dislocation, unrest and conflict. Policies to control unemployment and reduce its inequality-associated effects can strengthen long-run growth.
Concern extends even to such supporters (or former supporters) of laissez-faire economics and private sector financiers. Former Federal Reserve Board chairman Alan Greenspan, has stated reference to growing inequality: "This is not the type of thing which a democratic society – a capitalist democratic society – can really accept without addressing." Some economists (David Moss, Paul Krugman, Raghuram Rajan) believe the "Great Divergence" may be connected to the financial crisis of 2008. Money manager William H. Gross, former managing director of PIMCO, criticized the shift in distribution of income from labor to capital that underlies some of the growth in inequality as unsustainable, saying:
Even conservatives must acknowledge that return on capital investment, and the liquid stocks and bonds that mimic it, are ultimately dependent on returns to labor in the form of jobs and real wage gains. If Main Street is unemployed and undercompensated, capital can only travel so far down Prosperity Road.
He concluded: "Investors/policymakers of the world wake up – you're killing the proletariat goose that lays your golden eggs."
Among economists and reports that find inequality harming economic growth are a December 2013 Associated Press survey of three dozen economists', a 2014 report by Standard and Poor's, economists Gar Alperovitz, Robert Reich, Joseph Stiglitz, and Branko Milanovic.
A December 2013 Associated Press survey of three dozen economists found that the majority believe that widening income disparity is harming the US economy. They argue that wealthy Americans are receiving higher pay, but they spend less per dollar earned than middle class consumers, the majority of the population, whose incomes have largely stagnated.
A 2014 report by Standard and Poor's concluded that diverging income inequality has slowed the economic recovery and could contribute to boom-and-bust cycles in the future as more and more Americans take on debt in order to consume. Higher levels of income inequality increase political pressures, discouraging trade, investment, hiring, and social mobility according to the report.
Economists Gar Alperovitz and Robert Reich argue that too much concentration of wealth prevents there being sufficient purchasing power to make the rest of the economy function effectively.
Joseph Stiglitz argues that concentration of wealth and income leads the politically powerful economic elite seek to protect themselves from redistributive policies by weakening the state, and this leads to less public investments by the state – roads, technology, education, etc. – that are essential for economic growth.
According to economist Branko Milanovic, while traditionally economists thought inequality was good for growth, "The view that income inequality harms growth – or that improved equality can help sustain growth – has become more widely held in recent years. The main reason for this shift is the increasing importance of human capital in development. When physical capital mattered most, savings and investments were key. Then it was important to have a large contingent of rich people who could save a greater proportion of their income than the poor and invest it in physical capital. But now that human capital is scarcer than machines, widespread education has become the secret to growth." He continued that "Broadly accessible education" is both difficult to achieve when income distribution is uneven and tends to reduce "income gaps between skilled and unskilled labor."
Robert Gordon wrote that such issues as 'rising inequality; factor price equalization stemming from the interplay between globalization and the Internet; the twin educational problems of cost inflation in higher education and poor secondary student performance; the consequences of environmental regulations and taxes..." make economic growth harder to achieve than in the past.
Views that income inequality does not slow growth
In response to the Occupy movement Richard A. Epstein defended inequality in a free market society, maintaining that "taxing the top one percent even more means less wealth and fewer jobs for the rest of us." According to Epstein, "the inequalities in wealth ... pay for themselves by the vast increases in wealth", while "forced transfers of wealth through taxation ... will destroy the pools of wealth that are needed to generate new ventures. Some researchers have found a connection between lowering high marginal tax rates on high income earners (high marginal tax rates on high income being a common measure to fight inequality), and higher rates of employment growth. Government significant free market strategy affects too. the reason is there is a failure in the US political system to counterbalance the rise in unequal distribution of income amongst the citizens.
Economic sociologist Lane Kenworthy has found no correlation between levels of inequality and economic growth among developed countries, among states of the US, or in the US over the years from 1947 to 2005. Jared Bernstein found a nuanced relation he summed up as follows: "In sum, I'd consider the question of the extent to which higher inequality lowers growth to be an open one, worthy of much deeper research". Tim Worstall commented that capitalism would not seem to contribute to an inherited-wealth stagnation and consolidation, but instead appears to promote the opposite, a vigorous, ongoing turnover and creation of new wealth.
Likelihood of financial crises
Income inequality was cited as one of the causes of the Great Depression by Supreme Court Justice Louis D. Brandeis in 1933. In his dissent in the Louis K. Liggett Co. v. Lee (288 U.S. 517) case, he wrote: "Other writers have shown that, coincident with the growth of these giant corporations, there has occurred a marked concentration of individual wealth; and that the resulting disparity in incomes is a major cause of the existing depression."
Central Banking economist Raghuram Rajan argues that "systematic economic inequalities, within the United States and around the world, have created deep financial 'fault lines' that have made [financial] crises more likely to happen than in the past" – the Financial crisis of 2007–08 being the most recent example. To compensate for stagnating and declining purchasing power, political pressure has developed to extend easier credit to the lower and middle income earners – particularly to buy homes – and easier credit in general to keep unemployment rates low. This has given the American economy a tendency to go "from bubble to bubble" fueled by unsustainable monetary stimulation.
Monopolization of labor, consolidation, and competition
Greater income inequality can lead to monopolization of the labor force, resulting in fewer employers requiring fewer workers. Remaining employers can consolidate and take advantage of the relative lack of competition, leading to less consumer choice, market abuses, and relatively higher prices.
Aggregate demand and debt
Income inequality lowers aggregate demand, leading to increasingly large segments of formerly middle class consumers unable to afford as many luxury and essential goods and services. This pushes production and overall employment down.
Deep debt may lead to bankruptcy and researchers Elizabeth Warren and Amelia Warren Tyagi found a fivefold increase in the number of families filing for bankruptcy between 1980 and 2005. The bankruptcies came not from increased spending "on luxuries", but from an "increased spending on housing, largely driven by competition to get into good school districts." Intensifying inequality may mean a dwindling number of ever more expensive school districts that compel middle class – or would-be middle class – to "buy houses they can't really afford, taking on more mortgage debt than they can safely handle".
Overview
The ability to move from one income group into another (income mobility) is a means of measuring economic opportunity. A higher probability of upward income mobility theoretically would help mitigate higher income inequality, as each generation has a better chance of achieving higher income groups. Conservatives and libertarians such as economist Thomas Sowell, and Congressman Paul Ryan (R., Wisc.) argue that more important than the level of equality of results is America's equality of opportunity, especially relative to other developed countries such as western Europe.
Nonetheless, results from various studies reflect the fact that endogenous regulations and other different rules yield distinct effects on income inequality. A study examines the effects of institutional change on age-based labor market inequalities in Europe. There is a focus on wage-setting institutions on the adult male population and the rate of their unequal income distribution. According to the study, there is evidence that unemployment protection and temporary work regulation affect the dynamics of age-based inequality with positive employment effects of all individuals by the strength of unions. Even though the European Union is within a favorable economic context with perspectives of growth and development, it is also very fragile.
However, several studies have indicated that higher income inequality corresponds with lower income mobility. In other words, income brackets tend to be increasingly "sticky" as income inequality increases. This is described by a concept called the Great Gatsby curve. In the words of journalist Timothy Noah, "you can't really experience ever-growing income inequality without experiencing a decline in Horatio Alger-style upward mobility because (to use a frequently-employed metaphor) it's harder to climb a ladder when the rungs are farther apart."
Over lifetimes
The centrist Brookings Institution said in March 2013 that income inequality was increasing and becoming permanent, sharply reducing social mobility in the US. A 2007 study (by Kopczuk, Saez and Song in 2007) found the top population in the United States "very stable" and that income mobility had "not mitigated the dramatic increase in annual earnings concentration since the 1970s."
Economist Paul Krugman, attacks conservatives for resorting to "extraordinary series of attempts at statistical distortion". He argues that while in any given year, some of the people with low incomes will be "workers on temporary layoff, small businessmen taking writeoffs, farmers hit by bad weather" – the rise in their income in succeeding years is not the same 'mobility' as poor people rising to middle class or middle income rising to wealth. It's the mobility of "the guy who works in the college bookstore and has a real job by his early thirties."
Studies by the Urban Institute and the US Treasury have both found that about half of the families who start in either the top or the bottom quintile of the income distribution are still there after a decade, and that only 3 to 6% rise from bottom to top or fall from top to bottom.
On the issue of whether most Americans do not stay put in any one income bracket, Krugman quotes from 2011 CBO distribution of income study
Household income measured over a multi-year period is more equally distributed than income measured over one year, although only modestly so. Given the fairly substantial movement of households across income groups over time, it might seem that income measured over a number of years should be significantly more equally distributed than income measured over one year. However, much of the movement of households involves changes in income that are large enough to push households into different income groups but not large enough to greatly affect the overall distribution of income. Multi-year income measures also show the same pattern of increasing inequality over time as is observed in annual measures.
In other words, "many people who have incomes greater than $1 million one year fall out of the category the next year – but that's typically because their income fell from, say, $1.05 million to 0.95 million, not because they went back to being middle class."
Between generations
Several studies have found the ability of children from poor or middle-class families to rise to upper income – known as "upward relative intergenerational mobility" – is lower in the US than in other developed countries – and at least two economists have found lower mobility linked to income inequality.
In their Great Gatsby curve, White House Council of Economic Advisers Chairman Alan B. Krueger and labor economist Miles Corak show a negative correlation between inequality and social mobility. The curve plotted "intergenerational income elasticity" – i.e. the likelihood that someone will inherit their parents' relative position of income level – and inequality for a number of countries.
Aside from the proverbial distant rungs, the connection between income inequality and low mobility can be explained by the lack of access for un-affluent children to better (more expensive) schools and preparation for schools crucial to finding high-paying jobs; the lack of health care that may lead to obesity and diabetes and limit education and employment.
Krueger estimates that "the persistence in the advantages and disadvantages of income passed from parents to the children" will "rise by about a quarter for the next generation as a result of the rise in inequality that the U.S. has seen in the last 25 years."
Poverty
Greater income inequality can increase the poverty rate, as more income shifts away from lower income brackets to upper income brackets. Jared Bernstein wrote: "If less of the economy's market-generated growth – i.e., before taxes and transfers kick in – ends up in the lower reaches of the income scale, either there will be more poverty for any given level of GDP growth, or there will have to be a lot more transfers to offset inequality's poverty-inducing impact." The Economic Policy Institute estimated that greater income inequality would have added 5.5% to the poverty rate between 1979 and 2007, other factors equal. Income inequality was the largest driver of the change in the poverty rate, with economic growth, family structure, education and race other important factors. An estimated 16% of Americans lived in poverty in 2012, versus 26% in 1967.
A rise in income disparities weakens skills development among people with a poor educational background in term of the quantity and quality of education attained. Those with a low level of expertise will always consider themselves unworthy of any high position and pay
Further enrichment of corporate top executives
Lisa Shalett, chief investment officer at Merrill Lynch Wealth Management noted that, "for the last two decades and especially in the current period, ... productivity soared ... [but] U.S. real average hourly earnings are essentially flat to down, with today's inflation-adjusted wage equating to about the same level as that attained by workers in 1970. ... So where have the benefits of technology-driven productivity cycle gone? Almost exclusively to corporations and their very top executives." In addition to the technological side of it, the affected functionality emanates from the perceived unfairness and the reduced trust of people towards the state. The study by Kristal and Cohen showed that rising wage inequality has brought about an unhealthy competition between institutions and technology. The technological changes, with computerization of the workplace, seem to give an upper hand to the high-skilled workers as the primary cause of inequality in America. The qualified will always be considered to be in a better position as compared to those dealing with hand work leading to replacements and unequal distribution of resources.
Economist Timothy Smeeding summed up the current trend:
Americans have the highest income inequality in the rich world and over the past 20–30 years Americans have also experienced the greatest increase in income inequality among rich nations. The more detailed the data we can use to observe this change, the more skewed the change appears to be ... the majority of large gains are indeed at the top of the distribution.
According to Janet L. Yellen, chair of the Federal Reserve,
...from 1973 to 2005, real hourly wages of those in the 90th percentile – where most people have college or advanced degrees – rose by 30% or more... among this top 10 percent, the growth was heavily concentrated at the very tip of the top, that is, the top 1 percent. This includes the people who earn the very highest salaries in the U.S. economy, like sports and entertainment stars, investment bankers and venture capitalists, corporate attorneys, and CEOs. In contrast, at the 50th percentile and below – where many people have at most a high school diploma – real wages rose by only 5 to 10% –
Effects on democracy and society
Economists Jared Bernstein and Paul Krugman have attacked the concentration of income as variously "unsustainable" and "incompatible" with real democracy. American political scientists Jacob S. Hacker and Paul Pierson quote a warning by Greek-Roman historian Plutarch: "An imbalance between rich and poor is the oldest and most fatal ailment of all republics." Some academic researchers have written that the US political system risks drifting towards a form of oligarchy, through the influence of corporations, the wealthy, and other special interest groups.
Political polarization
Rising income inequality has been linked to the political polarization in Washington DC. According to a 2013 study published in the Political Research Quarterly, elected officials tend to be more responsive to the upper income bracket and ignore lower income groups.
Paul Krugman wrote in November 2014 that: "The basic story of political polarization over the past few decades is that, as a wealthy minority has pulled away economically from the rest of the country, it has pulled one major party along with it...Any policy that benefits lower- and middle-income Americans at the expense of the elite – like health reform, which guarantees insurance to all and pays for that guarantee in part with taxes on higher incomes – will face bitter Republican opposition." He used environmental protection as another example, which was not a partisan issue in the 1990s but has since become one.
As income inequality has increased, the degree of House of Representatives polarization measured by voting record has also increased. The voting is mostly by the rich and for the rich making it hard to achieve equal income and resource distribution for the average population (Bonica et al., 2013). There is a little number of people who turn to government insurance with the rising wealth and real income since they consider inequality within the different government sectors. Additionally, there has been an increased influence by the rich on the regulatory, legislative and electoral processes within the country that has led to improved employment standards for the bureaucrats and politicians. Professors McCarty, Pool and Rosenthal wrote in 2007 that polarization and income inequality fell in tandem from 1913 to 1957 and rose together dramatically from 1977 on. They show that Republicans have moved politically to the right, away from redistributive policies that would reduce income inequality. Polarization thus creates a feedback loop, worsening inequality.
Political inequality
Several economists and political scientists have argued that economic inequality translates into political inequality, particularly in situations where politicians have financial incentives to respond to special interest groups and lobbyists. Researchers such as Larry Bartels of Vanderbilt University have shown that politicians are significantly more responsive to the political opinions of the wealthy, even when controlling for a range of variables including educational attainment and political knowledge.
Class system
Historically, discussions of income inequality and capital vs. labor debates have sometimes included the language of class warfare, from President Theodore Roosevelt (referring to the leaders of big corporations as "malefactors of great wealth"), to President Franklin Roosevelt ("economic royalists...are unanimous in their hate for me--and I welcome their hatred"), to more the recent "1% versus the 99%" issue and the question of which political party better represents the interests of the middle class.
Investor Warren Buffett said in 2006 that: "There's class warfare, all right, but it's my class, the rich class, that's making war, and we're winning." He advocated much higher taxes on the wealthiest Americans, who pay lower effective tax rates than many middle-class persons.
Two journalists concerned about social separation in the US are economist Robert Frank, who notes that: "Today's rich had formed their own virtual country .. [T]hey had built a self-contained world unto themselves, complete with their own health-care system (concierge doctors), travel network (Net jets, destination clubs), separate economy...The rich weren't just getting richer; they were becoming financial foreigners, creating their own country within a country, their own society within a society, and their economy within an economy.
George Packer wrote that "Inequality hardens society into a class system ... Inequality divides us from one another in schools, in neighborhoods, at work, on airplanes, in hospitals, in what we eat, in the condition of our bodies, in what we think, in our children's futures, in how we die. Inequality makes it harder to imagine the lives of others.
Even these class levels can affect the politics in certain ways. There has been an increased influence by the rich on the regulatory, legislative and electoral processes within the country that has led to improved employment standards for the bureaucrats and politicians. They have a greater influence through their lobbying and contributions that give them an opportunity to immerse wealth for themselves.
Political change
Loss of income by the middle class relative to the top-earning 1% and 0.1% is both a cause and effect of political change, according to journalist Hedrick Smith. In the decade starting around 2000, business groups employed 30 times as many Washington lobbyists as trade unions and 16 times as many lobbyists as labor, consumer, and public interest lobbyists combined.
From 1998 through 2010 business interests and trade groups spent $28.6 billion on lobbying compared with $492 million for labor, nearly a 60-to-1 business advantage.
The result, according to Smith, is a political landscape dominated in the 1990s and 2000s by business groups, specifically "political insiders" – former members of Congress and government officials with an inside track – working for "Wall Street banks, the oil, defense, and pharmaceutical industries; and business trade associations." In the decade or so prior to the Great Divergence, middle-class-dominated reformist grassroots efforts – such as civil rights movement, environmental movement, consumer movement, labor movement – had considerable political impact.
Economist Joseph Stiglitz argues that hyper-inequality may explain political questions – such as why America's infrastructure (and other public investments) are deteriorating, or the country's recent relative lack of reluctance to engage in military conflicts such as the 2003 invasion of Iraq. Top-earning families, wealthy enough to buy their own education, medical care, personal security, and parks, have little interest in helping pay for such things for the rest of society, and the political influence to make sure they don't have to. So too, the lack of personal or family sacrifice involved for top earners in the military intervention of their country – their children being few and far between in the relatively low-paying all-volunteer military – may mean more willingness by influential wealthy to see its government wage war.
Economist Branko Milanovic argued that globalization and the related competition with cheaper labor from Asia and immigrants have caused U.S. middle-class wages to stagnate, fueling the rise of populist political candidates such as Donald Trump.
Health
The relatively high rates of health and social problems, (obesity, mental illness, homicides, teenage births, incarceration, child conflict, drug use) and lower rates of social goods (life expectancy, educational performance, trust among strangers, women's status, social mobility, even numbers of patents issued per capita), in the US compared to other developed countries may be related to its high income inequality. Using statistics from 23 developed countries and the 50 states of the US, British researchers Richard G. Wilkinson and Kate Pickett have found such a correlation which remains after accounting for ethnicity, national culture, and occupational classes or education levels. Their findings, based on UN Human Development Reports and other sources, locate the United States at the top of the list in regards to inequality and various social and health problems among developed countries. The authors argue inequality creates psychosocial stress and status anxiety that lead to social ills. A 2009 study conducted by researchers at Harvard University and published in the British Medical Journal attribute one in three deaths in the United States to high levels of inequality. According to The Earth Institute, life satisfaction in the US has been declining over the last several decades, which has been attributed to soaring inequality, lack of social trust and loss of faith in government.
It is claimed in a 2015 study by Princeton University researchers Angus Deaton and Anne Case that income inequality could be a driving factor in a marked increase in deaths among white males between the ages of 45 to 54 in the period 1999 to 2013.
Financing of social programs
Paul Krugman argues that the much lamented long-term funding problems of Social Security and Medicare can be blamed in part on the growth in inequality as well as the usual culprits like longer life expectancies. The traditional source of funding for these social welfare programs – payroll taxes – is inadequate because it does not capture income from capital, and income above the payroll tax cap, which make up a larger and larger share of national income as inequality increases.
Upward redistribution of income is responsible for about 43% of the projected Social Security shortfall over the next 75 years.
Education and human capital
Disagreeing with this focus on the top-earning 1%, and urging attention to the economic and social pathologies of lower-income/lower education Americans, is conservative journalist David Brooks. Whereas in the 1970s, high school and college graduates had "very similar family structures", today, high school grads are much less likely to get married and be active in their communities, and much more likely to smoke, be obese, get divorced, or have "a child out of wedlock."
The zooming wealth of the top one percent is a problem, but it's not nearly as big a problem as the tens of millions of Americans who have dropped out of high school or college. It's not nearly as big a problem as the 40 percent of children who are born out of wedlock. It's not nearly as big a problem as the nation's stagnant human capital, its stagnant social mobility and the disorganized social fabric for the bottom 50 percent.
Contradicting most of these arguments, classical liberals such as Friedrich Hayek have maintained that because individuals are diverse and different, state intervention to redistribute income is inevitably arbitrary and incompatible with the concept of general rules of law, and that "what is called 'social' or distributive' justice is indeed meaningless within a spontaneous order". Those who would use the state to redistribute, "take freedom for granted and ignore the preconditions necessary for its survival."
Public attitudes
The growth of inequality has provoked a political protest movement – the Occupy movement – starting in Wall Street and spreading to 600 communities across the United States in 2011. Its main political slogan – "We are the 99%" – references its dissatisfaction with the concentration of income in the top 1%.
A December 2011 Gallup poll found a decline in the number of Americans who felt reducing the gap in income and wealth between the rich and the poor was extremely or very important (21 percent of Republicans, 43 percent of independents, and 72 percent of Democrats). In 2012, several surveys of voters attitudes toward growing income inequality found the issue ranked less important than other economic issues such as growth and equality of opportunity, and relatively low in affecting voters "personally". In 1998 a Gallup poll had found 52% of Americans agreeing that the gap between rich and the poor was a problem that needed to be fixed, while 45% regarded it as "an acceptable part of the economic system". In 2011, those numbers are reversed: Only 45% see the gap as in need of fixing, while 52% do not. However, there was a large difference between Democrats and Republicans, with 71% of Democrats calling for a fix.
In contrast, a January 2014 poll found 61% of Republicans, 68% of Democrats and 67% of independents accept the notion that income inequality in the US has been growing over the last decade. The Pew Center poll also indicated that 69% of Americans supported the government doing "a lot" or "some" to address income inequality and that 73% of Americans supported raising the minimum wage from $7.25 to $10.10 per hour.
Opinion surveys of what respondents thought was the right level of inequality have found Americans no more accepting of income inequality than other citizens of other nations, but more accepting of what they thought the level of inequality was in their country, being under the impression that there was less inequality than there actually was. Dan Ariely and Michael Norton show in a study (2011) that US citizens across the political spectrum significantly underestimate the current US wealth inequality and would prefer a more egalitarian distribution of wealth. Joseph Stiglitz in "The Price of Inequality" has argued that this sense of unfairness has led to distrust in government and business.
States and cities
Income inequality (as measured by the Gini coefficient) is not uniform among the states: after-tax income inequality in 2009 was greatest in Texas and lowest in Maine. Income inequality has grown from 2005 to 2012 in more than 2 out of 3 metropolitan areas.
Comparisons by state
The household income Gini index for the United States was 0.468 in 2009, according to the US Census Bureau, though it varied significantly between states. The states of Utah, Alaska and Wyoming have a pre-tax income inequality Gini coefficient that is 10% lower than the average, while Washington D.C. and Puerto Rico 10% higher. After including the effects of federal and state taxes, the U.S. Federal Reserve estimates 34 states in the USA have a Gini coefficient between 0.30 and 0.35, with the state of Maine the lowest. At the county and municipality levels, the pre-tax Gini index ranged from 0.21 to 0.65 in 2010 across the United States, according to Census Bureau estimates.
Overall
Measured for all households, U.S. income inequality is comparable to other developed countries before taxes and transfers, but is among the worst after taxes and transfers, meaning the U.S. shifts relatively less income from higher income households to lower income households. Measured for working-age households, market income inequality is comparatively high (rather than moderate) and the level of redistribution is moderate (not low). These comparisons indicate Americans shift from reliance on market income to reliance on income transfers later in life and less fully than do households in other developed countries.
The U.S. was ranked the 41st worst among 141 countries (30th percentile) on income equality measured by the Gini index. The UN, CIA World Factbook, and OECD have used the Gini index to compare inequality between countries, and as of 2006, the United States had one of the highest levels of income inequality among similar developed or high income countries, as measured by the index. While inequality has increased since 1981 in two-thirds of OECD countries most developed countries are in the lower, more equal, end of the spectrum, with a Gini coefficient in the high twenties to mid thirties.
The gini rating (after taxes and government income transfers) of the United States is sufficiently high, however, to put it among less developed countries. The US ranks above (more unequal than) South American countries such Guyana, Nicaragua, and Venezuela, and roughly on par with Uruguay, Nicaragua, and Venezuela, according to the CIA.
The NYT reported in 2014: "With a big share of recent income gains in this country flowing to a relatively small slice of high-earning households, most Americans are not keeping pace with their counterparts around the world." Real median per capita income in many other industrialized countries was rising from 2000-2010 while the U.S. measure stagnated. The poor in much of Europe receive more than their U.S. counterparts.
Reasons for relative performance
One 2013 study indicated that U.S. income inequality is comparable to other developed countries before taxes and transfers, but rated last (worst) among 22 developed countries after taxes and transfers. This means that public policy choices, rather than market factors, drive U.S. income inequality disparities relative to comparable wealthy nations.
Some have argued that inequality is higher in other countries than official statistics indicate because of unreported income. European countries have higher amounts of wealth in offshore holdings.
The NYT reported in 2014 that there were three key reasons for other industrialized countries improving real median income relative to the United States over the 2000-2010 period:
Canada
According to The New York Times, Canadian middle class incomes are now higher than those in the United States as of 2014, and some European nations are closing the gap as their citizens have been receiving higher raises than their American counterparts. Bloomberg reported in August 2014 that only the wealthy saw pay increases since the 2008 recession, while average American workers saw no boost in their paychecks.
Overview
Economists have proposed a variety of solutions for addressing income inequality. For example, Federal Reserve Chair Janet Yellen described four "building blocks" that could help address income and wealth inequality in an October 2014 speech. These included expanding resources available to children, affordable higher education, business ownership, and inheritance. While before-tax income inequality is subject to market factors, after-tax income inequality can be directly affected by tax and transfer policy. U.S. income inequality is comparable to other developed nations before taxes and transfers, but is among the worst after taxes and transfers. This suggests that more progressive tax and transfer policies would be required to align the U.S. with other developed nations. The Center for American Progress recommended a series of steps in September 2014, including tax reform, subsidizing and reducing healthcare and higher education costs, and strengthening labor influence.
However, there is debate regarding whether a public policy response is appropriate for income inequality. For example, Federal Reserve Economist Thomas Garrett wrote in 2010: "It is important to understand that income inequality is a byproduct of a well-functioning capitalist economy. Individuals' earnings are directly related to their productivity...A wary eye should be cast on policies that aim to shrink the income distribution by redistributing income from the more productive to the less productive simply for the sake of 'fairness.'"
Public policy responses addressing causes and effects of income inequality include: progressive tax incidence adjustments, strengthening social safety net provisions such as Temporary Assistance for Needy Families, welfare, the food stamp program, Social Security, Medicare, and Medicaid, increasing and reforming higher education subsidies, increasing infrastructure spending, and placing limits on and taxing rent-seeking. Democrat and Republican politicians also provided a series of recommendations for increasing median wages in December 2014. These included raising the minimum wage, infrastructure stimulus, and tax reform.
Resources available to children
Research shows that children from lower-income households who get good-quality pre-Kindergarten education are more likely to graduate from high school, attend college, hold a job and have higher earnings. In 2010, the U.S. ranked 28th out of 38 advanced countries in the share of four-year-olds enrolled in public or private early childhood education. Gains in enrollment stalled after 2010, as did growth in funding, due to budget cuts arising from the Great Recession. Per-pupil spending in state-funded programs declined by 12% after inflation since 2010. The U.S. differs from other countries in that it funds public education primarily through sub-national (state and local) taxes. The quality of funding for public education varies based on the tax base of the school system, with significant variation in local taxes and spending per pupil. Better teachers also raise the educational attainment and future earnings of students, but they tend to migrate to higher income school districts. Among developed countries, 70% of 3-year-olds go to preschool, versus 38% in the United States.
Affordable higher education
Median annual earnings of full-time workers with a four-year bachelor's degree is 79% higher than the median for those with only a high school diploma. The wage premium for a graduate degree is considerably higher than the undergraduate degree. College costs have risen much faster than income, resulting in an increase in student loan debt from $260 billion in 2004 to $1.1 trillion in 2014. From 1995 to 2013, outstanding education debt grew from 26% of average yearly income to 58%, for households with net worth below the 50th percentile. The unemployment rate is also considerably lower for those with higher educational attainment. A college education is nearly free in many European countries, often funded by higher taxes.
Public welfare and infrastructure spending
The OECD asserts that public spending is vital in reducing the ever-expanding wealth gap. Lane Kenworthy advocates incremental reforms to the U.S. welfare state in the direction of the Nordic social democratic model, thereby increasing economic security and equal opportunity. Currently, the U.S. has the weakest social safety net of all developed nations.
Welfare spending may entice the poor away from finding remunerative work and toward dependency on the state. Eliminating social safety nets can discourage free market entrepreneurs by increasing the risk of business failure from a temporary setback to financial ruin.
Taxes on the wealthy
CBO reported that less progressive tax and transfer policies contributed to an increase in after-tax income inequality between 1979 and 2007. This indicates that more progressive income tax policies (e.g., higher income taxes on the wealthy and a higher earned-income tax credit) would reduce after-tax income inequality.
Recent policies enacted under President Obama increase taxes on the wealthy, including the American Taxpayer Relief Act of 2012 and the Affordable Care Act. As reported by The New York Times in January 2014, these laws include several tax increases on individuals earning over $400,000 and couples earning over $450,000:
These changes are estimated to add $600 billion to revenue over 10 years, while leaving the tax burden on everyone else mostly as it was. This reverses a long-term trend of lower tax rates for upper income persons.
The CBO estimated that the average tax rate for the top 1% rose from 28.1% in 2008 to 33.6% in 2013, reducing after-tax income inequality relative to a baseline without those policies.
The economists Emmanuel Saez and Thomas Piketty recommend much higher top marginal tax rates on the wealthy, up to 50 percent, or 70 percent or even 90 percent. Ralph Nader, Jeffrey Sachs, the United Front Against Austerity, among others, call for a financial transactions tax (also known as the Robin Hood tax) to bolster the social safety net and the public sector.
The Pew Center reported in January 2014 that 54% of Americans supported raising taxes on the wealthy and corporations to expand aid to the poor. By party, 29% of Republicans and 75% of Democrats supported this action.
During 2012, investor Warren Buffett advocated higher minimum effective income tax rates on the wealthy, considering all forms of income: "I would suggest 30 percent of taxable income between $1 million and $10 million, and 35 percent on amounts above that." This would eliminate special treatment for capital gains and carried interest, which are taxed at lower rates and comprise a relatively larger share of income for the wealthy. He argued that in 1992, the tax paid by the 400 highest incomes in the United States averaged 26.4% of adjusted gross income. In 2009, the rate was 19.9%.
Reduce tax expenditures
Tax expenditures (i.e., exclusions, deductions, preferential tax rates, and tax credits) cause revenues to be much lower than they would otherwise be for any given tax rate structure. The benefits from tax expenditures, such as income exclusions for healthcare insurance premiums paid for by employers and tax deductions for mortgage interest, are distributed unevenly across the income spectrum. They are often what the Congress offers to special interests in exchange for their support. According to a report from the CBO that analyzed the 2013 data:
Understanding how each tax expenditure is distributed across the income spectrum can inform policy choices.
Corporate tax reform
Economist Dean Baker argues that the existence of tax loopholes, deductions, and credits for the corporate income tax contributes to rising income inequality by permitting large corporations with many accountants to reduce their tax burden and by permitting large accounting firms to receive payments from smaller businesses in exchange for helping these businesses reduce their tax burden. He says that this redistributes large sums of money that would otherwise be taxed to individuals who are already wealthy yet contribute nothing to society in order to obtain this wealth. He further argues that since a large portion of corporate income is reinvested in the business, taxing corporate income amounts to a tax on reinvestment, which he says should be left untaxed. He concludes that eliminating the corporate income tax, while needing to be offset by revenue increases elsewhere, would reduce income inequality.
Minimum wages
In his 2013 State of the Union address, Barack Obama proposed raising the federal minimum wage. The progressive economic think tank the Economic Policy Institute agrees with this position, stating: "Raising the minimum wage would help reverse the ongoing erosion of wages that has contributed significantly to growing income inequality." In response to the fast-food worker strikes of 2013, Labor Secretary Thomas Perez said that it was another sign of the need to raise the minimum wage for all workers: "It's important to hear that voice... For all too many people working minimum wage jobs, the rungs on the ladder of opportunity are feeling further and further apart."
The Economist wrote in December 2013: "A minimum wage, providing it is not set too high, could thus boost pay with no ill effects on jobs....America's federal minimum wage, at 38% of median income, is one of the rich world's lowest. Some studies find no harm to employment from federal of state minimum wages, others see a small one, but none finds any serious damage."
The U.S. minimum wage was last raised to $7.25 per hour in July 2009. As of December 2013, there were 21 states with minimum wages above the Federal minimum, with the State of Washington the highest at $9.32. Ten states index their minimum wage to inflation.
The Pew Center reported in January 2014 that 73% of Americans supported raising the minimum wage from $7.25 to $10.10 per hour. By party, 53% of Republicans and 90% of Democrats favored this action. Also in January 2014, six hundred economists sent the President and Congress a letter urging for a minimum wage hike to $10.10 an hour by 2016.
In February 2014, the CBO reported the effects of a minimum wage increase under two scenarios, an increase to $10.10 with indexing for inflation thereafter and an increase to $9.00 with no indexing:
Maximum wage implementation
Amalgamated Transit Union international president Lawrence J. Hanley has called for a maximum wage law, which "would limit the amount of compensation an employer could receive to a specified multiple of the wage earned by his or her lowest paid employees." CEO pay at the largest 350 U.S. companies was 20 times the average worker pay in 1965; 58 times in 1989 and 273 times in 2012.
Subsidies and income guarantees
Others argue for a Basic income guarantee, ranging from civil rights leader Martin Luther King, Jr. to libertarians such as Milton Friedman (in the form of negative income tax), Robert Anton Wilson, Gary Johnson (In the form of the fair tax "prebate") and Charles Murray to the Green Party.
Rent-seeking limits
General limitations on and taxation of rent-seeking is popular with large segments of both Republicans and Democrats.
Economic democracy
The economists Richard D. Wolff and Gar Alperovitz claim that greater economic equality could be achieved by extending democracy into the economic sphere. In an essay for Harper's Magazine, investigative journalist Erik Reece argues that "With the political right entrenched in its opposition to unions, worker-owned cooperatives represent a less divisive yet more radical model for returning wealth to the workers who earned it."
Monetary policy
The effect on income inequality of monetary policy pursued by the Federal Reserve is challenging to measure. Monetary policy can be used to stimulate the economy (e.g., by lowering interest rates, which encourages borrowing and spending, additional job creation, and inflationary pressure) or tightened, with the opposite effects. Former Fed Chair Ben Bernanke wrote in June 2015 that there are several effects on income and wealth inequality from monetary stimulus that work in opposing directions:
Overview
Various methods are used to determine income inequality and different sources may give different figures for gini coefficients or ratio different ratio of percentiles, etc.. The United States Census Bureau studies on inequality of household income and individual income show lower levels of inequality than some other sources (Saez and Piketty, and the CBO), but do not include data for the highest-income households where most of change in income distribution has occurred.
Two commonly cited sources of income inequality data are the CBO and economist Emmanuel Saez, which differ somewhat in their sources and methods. According to Saez, for 2011 the share of "market income less transfers" received by the top 1% was about 19.5%. Saez used IRS data in this measure. The CBO uses both IRS data and Census data in its computations and reported a lower "pre-tax" figure for the top 1% of 14.6%. The two data series were approximately 5 percentage points apart in recent years.
Internal Revenue Service (IRS) data
Pioneers in the use of IRS income data to analyze income distribution are Emmanuel Saez and Thomas Piketty at the Paris School of Economics showed that the share of income held by the top 1 percent was as large in 2005 as in 1928. Other sources that have noted the increased inequality included economist Janet Yellen who stated, "the growth [in real income] was heavily concentrated at the very tip of the top, that is, the top 1 percent." Follow-up research, published in 2014, by Emmanuel Saez and Gabriel Zucman revealed that more than half of those in the top 1 percent had not experienced relative gains in wealth between 1960 and 2012. In fact, those between the top 1 percent and top .5 percent had actually lost relative wealth. Only those in the top .1 percent and above had made relative wealth gains during that time.
Census Bureau data
The comparative use of Census Bureau data, as well as most sources of demographic income data, has been questioned by statisticians for being unable to account for 'mobility of incomes'. At any given time, the Census Bureau ranks all households by household income and then divides this distribution of households into quintiles. The highest-ranked household in each quintile provides the upper income limit for each quintile. Comparing changes in these upper income limits for different quintiles is how changes are measured between one moment in time and the next. The problem with inferring income inequality on this basis is that the census statistics provide only a snapshot of income distribution in the U.S., at individual points in time. The statistics do not reflect the reality that income for many households changes over time – i.e., incomes are mobile. For most people, income increases over time as they move from their first, low-paying job in high school to a better-paying job later in their lives. Also, some people lose income over time because of business-cycle contractions, demotions, career changes, retirement, etc. The implication of changing individual incomes is that individual households do not remain in the same income quintiles over time. Thus, comparing different income quintiles over time is like comparing apples to oranges, because it means comparing incomes of different people at different stages in their earnings profile.
Gary Burtless of the Brookings Institution notes that many economists and analysts who use U.S. census data fail to recognize recent and significant lower- and middle-income gains, primarily because census data does not capture key information: "A commonly used indicator of middle class income is the Census Bureau's estimate of median household money income. The main problem with this income measure is that it only reflects households' before-tax cash incomes. It fails to account for changing tax burdens and the impact of income sources that do not take the form of cash. This means, for example, that tax cuts in 2001-2003 and 2008-2012 are missed in the census statistics. Furthermore, the Census Bureau measure ignores income received as in-kind benefits and health insurance coverage from employers and the government. By ignoring such benefits as well as sizeable tax cuts in the recession, the Census Bureau's money income measure seriously overstated the income losses that middle-income families suffered in the recession.
New CBO income statistics are beginning to show the growing importance of these items. In 1980, in-kind benefits and employer and government spending on health insurance accounted for just 6% of the after-tax incomes of households in the middle one-fifth of the distribution. By 2010 these in-kind income sources represented 17% of middle class households' after-tax income. The income items missed by the Census Bureau are increasing faster than the income items included in its money income measure. What many observers miss, however, is the success of the nation's tax and transfer systems in protecting low- and middle-income Americans against the full effects of a depressed economy. As a result of these programs, the spendable incomes of poor and middle-class families have been better insulated against recession-driven losses than the incomes of Americans in the top 1%. As the CBO statistics demonstrate, incomes in the middle and at the bottom of the distribution have fared better since 2000 than incomes at the very top."
Income measures: Pre-and post-tax
Inequality can be measured before and after the effects of taxes and transfer payments such as social security and unemployment insurance.
Demographic issues
Comparisons of income over time should adjust for changes in average age, family size, number of breadwinners, and other characteristics of a population. Measuring personal income ignores dependent children, but household income also has problems – a household of ten has a lower standard of living than one of two people, though the income of the two households may be the same. People's earnings tend to rise over their working lifetimes, so "snapshot measures of income inequality can be misleading." The inequality of a recent college graduate and a 55-year-old at the peak of his/her career is not an issue if the graduate has the same career path.
Conservative researchers and organizations have focused on the flaws of household income as a measure for standard of living in order to refute claims that income inequality is growing, becoming excessive or posing a problem for society. According to sociologist Dennis Gilbert, growing inequality can be explained in part by growing participation of women in the workforce. High earning households are more likely to be dual earner households, And according to a 2004 analysis of income quintile data by the Heritage Foundation, inequality becomes less when household income is adjusted for size of household. Aggregate share of income held by the upper quintile (the top earning 20 percent) decreases by 20.3% when figures are adjusted to reflect household size.
However the Pew Research Center found household income has appeared to decline less than individual income in the twenty-first century because those who are no longer able to afford their own housing have increasingly been moving in with relatives, creating larger households with more income earners in them. The 2011 CBO study "Trends in the Distribution of Household Income" mentioned in this article adjusts for household size so that its quintiles contain an equal number of people, not an equal number of households. Looking at the issue of how frequently workers or households move into higher or lower quintiles as their income rises or falls over the years, the CBO found income distribution over a multi-year period "modestly" more equal than annual income. The CBO study confirms earlier studies.
Overall, according to Timothy Noah, correcting for demographic factors (today's population is older than it was 33 years ago, and divorce and single parenthood have made households smaller), you find that income inequality, though less extreme than shown by the standard measure, is also growing faster than shown by the standard measure.
Gini index
The Gini coefficient summarizes income inequality in a single number and is one of the most commonly used measures of income inequality. It uses a scale from 0 to 1 – the higher the number the more inequality. Zero represents perfect equality (everyone having exactly the same income), and 1 represents perfect inequality (one person having all income). (Index scores are commonly multiplied by 100 to make them easier to understand.) Gini index ratings can be used to compare inequality within (by race, gender, employment) and between countries, before and after taxes. Different sources will often give different gini values for the same country or population measured. For example, the U.S. Census Bureau's official Gini coefficient for the United States was 47.6 in 2013, up from 45.4 in 1993, the earliest year for comparable data. By contrast, the OECD's Gini coefficient for income inequality in the United States is 37 in 2012 (including wages and other cash transfers), which is still the highest in the developed world, with the lowest being Denmark (24.3), Norway (25.6), and Sweden (25.9).
Professor Salvatore Babones of the University of Sydney notes:
A major gap in the measurement of income inequality is the exclusion of capital gains, profits made on increases in the value of investments. Capital gains are excluded for purely practical reasons. The Census doesn't ask about them, so they can't be included in inequality statistics.
Obviously, the rich earn much more from investments than the poor. As a result, real levels of income inequality in America are much higher than the official Census Bureau figures would suggest.
Measuring inequality through consumption vs. income
Conservative researchers have argued that income inequality is not significant because consumption, rather than income should be the measure of inequality, and inequality of consumption is less extreme than inequality of income in the US. Will Wilkinson of the libertarian Cato Institute states that "the weight of the evidence shows that the run-up in consumption inequality has been considerably less dramatic than the rise in income inequality," and consumption is more important than income. According to Johnson, Smeeding, and Tory, consumption inequality was actually lower in 2001 than it was in 1986. The debate is summarized in "The Hidden Prosperity of the Poor" by journalist Thomas B. Edsall. Other studies have not found consumption inequality less dramatic than household income inequality, and the CBO's study found consumption data not "adequately" capturing "consumption by high-income households" as it does their income, though it did agree that household consumption numbers show more equal distribution than household income.
Others dispute the importance of consumption over income, pointing out that if middle and lower income are consuming more than they earn it is because they are saving less or going deeper into debt. A "growing body of work" suggests that income inequality has been the driving factor in the growing household debt, as high earners bid up the price of real estate and middle income earners go deeper into debt trying to maintain what once was a middle class lifestyle. Between 1983 and 2007, the top 5 percent saw their debt fall from 80 cents for every dollar of income to 65 cents, while the bottom 95 percent saw their debt rise from 60 cents for every dollar of income to $1.40. Economist Krugman has found a strong correlation between inequality and household debt in the United States over the last hundred years.
Wealth inequality
Related to income inequality is the topic of wealth inequality, which refers to the distribution of net worth (i.e., what is owned minus what is owed) as opposed to annual income. Net worth is affected by movements in the prices of assets, such as stocks, bonds, and real estate, which can fluctuate significantly over the short-term. Income inequality also has a significant effect over long-term shifts in wealth inequality, as income is accumulated. Wealth inequality is also highly concentrated and increasing:
The increase in wealth for the 1% was not homogeneous, with much of the wealth gains in the top 0.1%. Those between the top 1 percent and top 0.5 percent have actually lost a significant share of wealth over the past 50 years.
Further, the top 400 Americans had net worth of $2 trillion in 2013, which was more than the combined net worth of the bottom 50% of U.S. households. The average net worth of these 400 Americans was $5 billion. The lower 50% of households held 3% of the wealth in 1989 and 1% in 2013. The average net worth of the bottom 50% of households in 2013 was approximately $11,000.
This wealth inequality is apparent in the share of assets held. In 2010, the top 5% wealthiest households had approximately 72% of the financial wealth, while the bottom 80% of households had 5%. Financial wealth is measured as net worth minus home values, meaning income-generating financial assets like stocks and bonds, plus business equity.
The Center for American Progress reported in September 2014 that: "The trends in rising inequality are also striking when measured by wealth. Among the top 20 percent of families by net worth, average wealth increased by 120 percent between 1983 and 2010, while the middle 20 percent of families only saw their wealth increase by 13 percent, and the bottom fifth of families, on average, saw debt exceed assets – in other words, negative net worth...Homeowners in the bottom quintile of wealth lost an astounding 94 percent of their wealth between 2007 and 2010."