
District Thierstein Elevation 592 m Population 576 (31 Dec 2008) | SFOS number 2622 Local time Sunday 3:26 PM Postal code 4234 | |
 | ||
Website www.zullwil.ch SFSO statistics Weather 12°C, Wind NW at 8 km/h, 65% Humidity | ||
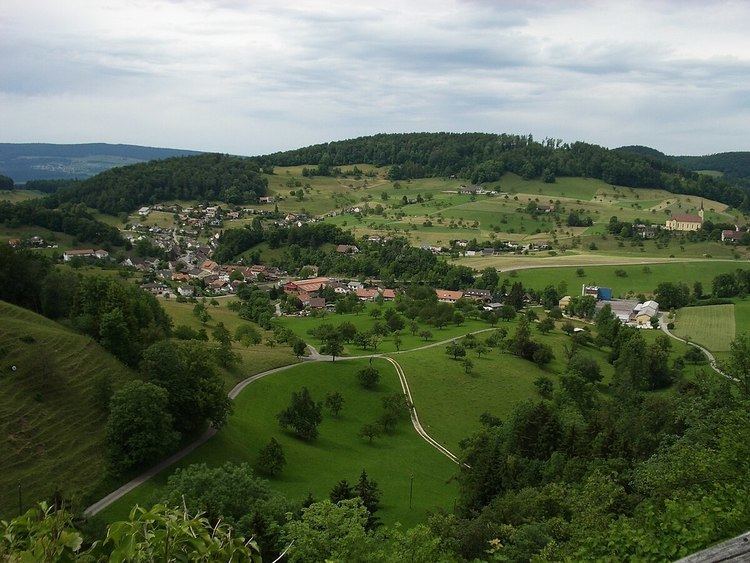
Zullwil is a municipality in the district of Thierstein in the canton of Solothurn in Switzerland.
Contents
- Map of Zullwil Switzerland
- Geography
- Coat of arms
- Demographics
- Politics
- Economy
- Religion
- Education
- References
Map of Zullwil, Switzerland
Geography
Zullwil has an area, as of 2009, of 3.64 square kilometers (1.41 sq mi). Of this area, 1.6 km2 (0.62 sq mi) or 44.0% is used for agricultural purposes, while 1.67 km2 (0.64 sq mi) or 45.9% is forested. Of the rest of the land, 0.35 km2 (0.14 sq mi) or 9.6% is settled (buildings or roads), 0.01 km2 (2.5 acres) or 0.3% is either rivers or lakes.
Of the built up area, housing and buildings made up 6.6% and transportation infrastructure made up 1.6%. Out of the forested land, 43.4% of the total land area is heavily forested and 2.5% is covered with orchards or small clusters of trees. Of the agricultural land, 3.3% is used for growing crops and 31.3% is pastures, while 4.9% is used for orchards or vine crops and 4.4% is used for alpine pastures. All the water in the municipality is flowing water.
Coat of arms
The blazon of the municipal coat of arms is Quarterly Sable and Argent two Staffs fleury conterchanged in saltire.
Demographics
Zullwil has a population (as of December 2015) of 638. As of 2008, 4.0% of the population are resident foreign nationals. Over the last 10 years (1999–2009 ) the population has changed at a rate of -4.9%. It has changed at a rate of -5.4% due to migration and at a rate of -1.1% due to births and deaths.
Most of the population (as of 2000) speaks German (570 or 94.1%), with Albanian being second most common (15 or 2.5%) and French being third (4 or 0.7%). There are 2 people who speak Romansh.
As of 2008, the gender distribution of the population was 51.6% male and 48.4% female. The population was made up of 292 Swiss men (47.8% of the population) and 23 (3.8%) non-Swiss men. There were 279 Swiss women (45.7%) and 17 (2.8%) non-Swiss women. Of the population in the municipality 265 or about 43.7% were born in Zullwil and lived there in 2000. There were 137 or 22.6% who were born in the same canton, while 139 or 22.9% were born somewhere else in Switzerland, and 54 or 8.9% were born outside of Switzerland.
In 2008 there were 5 live births to Swiss citizens and were 10 deaths of Swiss citizens. Ignoring immigration and emigration, the population of Swiss citizens decreased by 5 while the foreign population remained the same. There was 1 Swiss man who immigrated back to Switzerland. At the same time, there was 1 non-Swiss man who immigrated from another country to Switzerland. The total Swiss population change in 2008 (from all sources, including moves across municipal borders) was a decrease of 19 and the non-Swiss population decreased by 5 people. This represents a population growth rate of -4.0%.
The age distribution, as of 2000, in Zullwil is; 50 children or 8.3% of the population are between 0 and 6 years old and 106 teenagers or 17.5% are between 7 and 19. Of the adult population, 32 people or 5.3% of the population are between 20 and 24 years old. 163 people or 26.9% are between 25 and 44, and 161 people or 26.6% are between 45 and 64. The senior population distribution is 67 people or 11.1% of the population are between 65 and 79 years old and there are 27 people or 4.5% who are over 80.
As of 2000, there were 252 people who were single and never married in the municipality. There were 300 married individuals, 37 widows or widowers and 17 individuals who are divorced.
As of 2000, there were 237 private households in the municipality, and an average of 2.5 persons per household. There were 60 households that consist of only one person and 27 households with five or more people. Out of a total of 240 households that answered this question, 25.0% were households made up of just one person and there were 3 adults who lived with their parents. Of the rest of the households, there are 72 married couples without children, 88 married couples with children There were 11 single parents with a child or children. There were 3 households that were made up of unrelated people and 3 households that were made up of some sort of institution or another collective housing.
In 2000 there were 140 single family homes (or 71.4% of the total) out of a total of 196 inhabited buildings. There were 29 multi-family buildings (14.8%), along with 23 multi-purpose buildings that were mostly used for housing (11.7%) and 4 other use buildings (commercial or industrial) that also had some housing (2.0%). Of the single family homes 11 were built before 1919, while 15 were built between 1990 and 2000. The greatest number of single family homes (30) were built between 1946 and 1960.
In 2000 there were 261 apartments in the municipality. The most common apartment size was 4 rooms of which there were 79. There were 4 single room apartments and 113 apartments with five or more rooms. Of these apartments, a total of 234 apartments (89.7% of the total) were permanently occupied, while 12 apartments (4.6%) were seasonally occupied and 15 apartments (5.7%) were empty. As of 2009, the construction rate of new housing units was 6.7 new units per 1000 residents. The vacancy rate for the municipality, in 2010, was 2.79%.
The historical population is given in the following chart:
Politics
In the 2007 federal election the most popular party was the FDP which received 31.07% of the vote. The next three most popular parties were the SVP (28.79%), the CVP (23.18%) and the SP (10.87%). In the federal election, a total of 209 votes were cast, and the voter turnout was 46.0%.
Economy
As of 2010, Zullwil had an unemployment rate of 2.9%. As of 2008, there were 17 people employed in the primary economic sector and about 9 businesses involved in this sector. 84 people were employed in the secondary sector and there were 8 businesses in this sector. 16 people were employed in the tertiary sector, with 4 businesses in this sector. There were 295 residents of the municipality who were employed in some capacity, of which females made up 39.3% of the workforce.
In 2008 the total number of full-time equivalent jobs was 100. The number of jobs in the primary sector was 11, all of which were in agriculture. The number of jobs in the secondary sector was 78 of which 51 or (65.4%) were in manufacturing and 28 (35.9%) were in construction. The number of jobs in the tertiary sector was 11. In the tertiary sector; 3 or 27.3% were in wholesale or retail sales or the repair of motor vehicles, 2 or 18.2% were in a hotel or restaurant, 5 or 45.5% were in education.
In 2000, there were 91 workers who commuted into the municipality and 243 workers who commuted away. The municipality is a net exporter of workers, with about 2.7 workers leaving the municipality for every one entering. About 8.8% of the workforce coming into Zullwil are coming from outside Switzerland. Of the working population, 21.7% used public transportation to get to work, and 59.7% used a private car.
Religion
From the 2000 census, 438 or 72.3% were Roman Catholic, while 61 or 10.1% belonged to the Swiss Reformed Church. Of the rest of the population, there were 3 members of an Orthodox church (or about 0.50% of the population), and there were 9 individuals (or about 1.49% of the population) who belonged to another Christian church. There were 28 (or about 4.62% of the population) who were Islamic. 56 (or about 9.24% of the population) belonged to no church, are agnostic or atheist, and 11 individuals (or about 1.82% of the population) did not answer the question.
Education
In Zullwil about 227 or (37.5%) of the population have completed non-mandatory upper secondary education, and 40 or (6.6%) have completed additional higher education (either university or a Fachhochschule). Of the 40 who completed tertiary schooling, 77.5% were Swiss men, 17.5% were Swiss women.
During the 2010-2011 school year there were a total of 10 students in the Zullwil school system. The education system in the Canton of Solothurn allows young children to attend two years of non-obligatory Kindergarten. During that school year, there were 10 children in kindergarten. The canton's school system requires students to attend six years of primary school, with some of the children attending smaller, specialized classes. In the municipality there were students in primary school. The secondary school program consists of three lower, obligatory years of schooling, followed by three to five years of optional, advanced schools. All the lower secondary students from Zullwil attend their school in a neighboring municipality.
As of 2000, there was one student in Zullwil who came from another municipality, while 76 residents attended schools outside the municipality.